Matplotlib的imshow()函数颜色映射(cmap的取值)
plt.imshow()函数
matplotlib.pyplot.imshow(X, cmap=None, norm=None, aspect=None, interpolation=None, alpha=None, vmin=None, vmax=None, origin=None, extent=None,shape=None, filternorm=1, filterrad=4.0, imlim=None, resample=None, url=None, hold=None, data=None, **kwargs)
Display an image on the axes.
- X [array_like, shape (n, m) or (n, m, 3) or (n, m, 4)] Display the image in X to current axes. X may be an array or a PIL image. If X is an array, it can have the following shapes and types:
• MxN – values to be mapped (float or int)
• MxNx3 – RGB (float or uint8)
• MxNx4 – RGBA (float or uint8)
MxN arrays are mapped to colors based on the norm (mapping scalar to scalar)
and the cmap (mapping the normed scalar to a color).
Elements of RGB and RGBA arrays represent pixels of an MxN image. All values
should be in the range [0 … 1] for floats or [0 … 255] for integers. Out-of-range
values will be clipped to these bounds. - cmap [Colormap, optional, default: None] If None, default to rc image.cmap value. cmap is ignored if X is 3-D, directly specifying RGB(A) values.
- aspect [[’auto’ | ’equal’ | scalar], optional, default: None] If ’auto’, changes the
image aspect ratio to match that of the axes. If ’equal’, and extent is None, changes the axes aspect ratio to match that of the image. If extent is not None, the axes aspect ratio is changed to match that of
the extent. If None, default to rc image.aspect value. - interpolation [string, optional, default: None] Acceptable values are ’none’, ’nearest’, ’bilinear’, ’bicubic’, ’spline16’, ’spline36’, ’hanning’, ’hamming’, ’hermite’, ’kaiser’, ’quadric’, ’catrom’, ’gaussian’, ’bessel’, ’mitchell’, ’sinc’, ’lanczos’
If interpolation is None, default to rc image.interpolation. See also the
filternorm and filterrad parameters. If interpolation is ’none’, then no
interpolation is performed on the Agg, ps and pdf backends. Other backends will fall back to ’nearest’. - norm [Normalize, optional, default: None] A Normalize instance is used to scale a 2-D float X input to the (0, 1) range for input to the cmap. If norm is None, use the default func:normalize. If norm is an instance of NoNorm, X must be an array of integers that index directly into the lookup table of the cmap.
- vmin, vmax [scalar, optional, default: None] vmin and vmax are used in conjunction with norm to normalize luminance data. Note if you pass a norm instance, your settings for vmin and vmax will be ignored.
- alpha [scalar, optional, default: None] The alpha blending value, between 0 (transparent) and 1 (opaque). The alpha argument is ignored for RGBA input data.
- origin [[’upper’ | ’lower’], optional, default: None] Place the [0,0] index of the array in the upper left or lower left corner of the axes. If None, default to rc image.origin.
- extent [scalars (left, right, bottom, top), optional, default: None] The location, in data-coordinates, of the lower-left and upper-right corners. If None, the image is positioned such that the pixel centers fall on zero-based (row, column) indices.
- shape [scalars (columns, rows), optional, default: None] For raw buffer images
- filternorm [scalar, optional, default: 1] A parameter for the antigrain image resize filter. From the antigrain documentation, if filternorm = 1, the filter normalizes integer values and corrects the rounding errors. It doesn’t do anything with the source floating point values, it corrects only integers according to the rule of 1.0
which means that any sum of pixel weights must be equal to 1.0. So, the filter
function must produce a graph of the proper shape. - filterrad [scalar, optional, default: 4.0] The filter radius for filters that have a radius parameter, i.e. when interpolation is one of: ’sinc’, ’lanczos’ or ’blackman’
- Returns
image [AxesImage]
官方文档截图如下
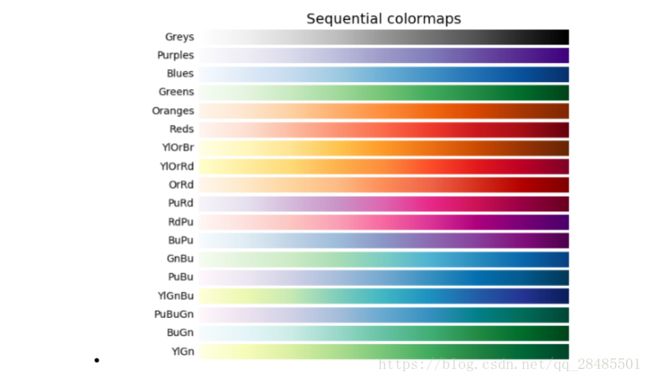
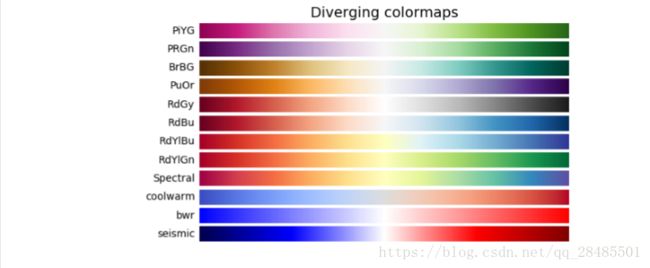
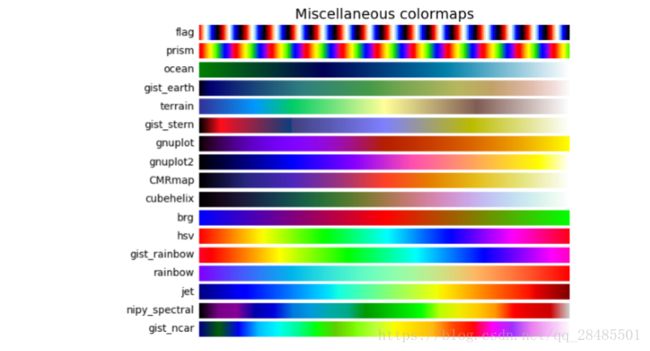
可能的取值
可能的取值:
Accent, Accent_r, Blues, Blues_r, BrBG, BrBG_r, BuGn, BuGn_r, BuPu, BuPu_r, CMRmap, CMRmap_r, Dark2, Dark2_r, GnBu, GnBu_r, Greens, Greens_r, Greys, Greys_r, OrRd, OrRd_r, Oranges, Oranges_r, PRGn, PRGn_r, Paired, Paired_r, Pastel1, Pastel1_r, Pastel2, Pastel2_r, PiYG, PiYG_r, PuBu, PuBuGn, PuBuGn_r, PuBu_r, PuOr, PuOr_r, PuRd, PuRd_r, Purples, Purples_r, RdBu, RdBu_r, RdGy, RdGy_r, RdPu, RdPu_r, RdYlBu, RdYlBu_r, RdYlGn, RdYlGn_r, Reds, Reds_r, Set1, Set1_r, Set2, Set2_r, Set3, Set3_r, Spectral, Spectral_r, Wistia, Wistia_r, YlGn, YlGnBu, YlGnBu_r, YlGn_r, YlOrBr, YlOrBr_r, YlOrRd, YlOrRd_r, afmhot, afmhot_r, autumn, autumn_r, binary, binary_r, bone, bone_r, brg, brg_r, bwr, bwr_r, cividis, cividis_r, cool, cool_r, coolwarm, coolwarm_r, copper, copper_r, cubehelix, cubehelix_r, flag, flag_r, gist_earth, gist_earth_r, gist_gray, gist_gray_r, gist_heat, gist_heat_r, gist_ncar, gist_ncar_r, gist_rainbow, gist_rainbow_r, gist_stern, gist_stern_r, gist_yarg, gist_yarg_r, gnuplot, gnuplot2, gnuplot2_r, gnuplot_r, gray, gray_r, hot, hot_r, hsv, hsv_r, inferno, inferno_r, jet, jet_r, magma, magma_r, nipy_spectral, nipy_spectral_r, ocean, ocean_r, pink, pink_r, plasma, plasma_r, prism, prism_r, rainbow, rainbow_r, seismic, seismic_r, spring, spring_r, summer, summer_r, tab10, tab10_r, tab20, tab20_r, tab20b, tab20b_r, tab20c, tab20c_r, terrain, terrain_r, viridis, viridis_r, winter, winter_r
序列内容


for循环来输出描绘颜色映射