实战:基于技术分析的Python算法交易
译者 | Tianyu
出品 | AI科技大本营(ID:rgznai100)
本文是用 Python 做交易策略回测系列文章的第四篇。上个部分介绍了以下几个方面内容:
-
介绍了 zipline 回测框架,并展示了如何回测基本的策略
-
导入自定义的数据并使用 zipline
-
评估交易策略的表现
这篇文章的目的是介绍如何基于技术分析(TA, Technical Analysis)来创建交易策略。在此引用维基百科的解释,技术分析是指“基于对市场的历史数据、成交价格、交易量的研究,来预测价格走势的一套方法”。
在本文中,我会介绍如何使用流行的 Python 库 TA-Lib 以及 zipline 回测框架来计算 TA 指标。我会创建 5 种策略,然后研究哪种策略在投资期限内表现最好。
安装
我用到的库有以下几个:
pyfolio 0.9.2
numpy 1.14.6
matplotlib 3.0.0
pandas 0.22.0
json 2.0.9
empyrical 0.5.0
zipline 1.3.0
辅助函数
在构造策略之前,我要先定义几个辅助函数(此处我只介绍其中一个,因为它是最重要的一个)。
这个函数用来设置回测的起始时间,因为我希望所有策略开始实施的时间保持一致,设置为2016年的第一天。不过,有些基于技术指标的策略需要一定数量的历史数据,也就是所谓的 warm-up 阶段。请一定记住一点,没有任何交易决策会发生在回测期的起始时间之前。
def get_start_date(ticker, start_date, days_prior):
start_date_dt = datetime.strptime(start_date, '%Y-%m-%d')
prior_to_start_date_dt = start_date_dt - relativedelta(days=2 * days_prior)
prior_to_start_date = prior_to_start_date_dt.strftime('%Y-%m-%d')
yahoo_financials = YahooFinancials(ticker)
df = yahoo_financials.get_historical_price_data(
prior_to_start_date, start_date, 'daily')
df = pd.DataFrame(df[ticker]['prices'])['formatted_date']
if df.iloc[-1] == start_date:
days_prior += 1
new_start_date = df.iloc[-days_prior]
return new_start_date
策略
本篇文章中,我们要解决的问题如下:
-
投资者有 10000 元的本金
-
投资时限为 2016-2017
-
投资者仅投资 Tesla 的股票
-
假设不存在交易成本,即交易佣金为零
-
不存在做空行为(投资者只能出售他们拥有的股票)
-
当投资者购买股票时,他们会花掉全部本金
之所以选择这段时期,是因为2018年中后的 Quandl 数据集还没有更新,我们希望代码可以尽可能简化。关于如何将数据载入 zipline 的更多细节,请参考到我之前的文章。
买入和持有的策略
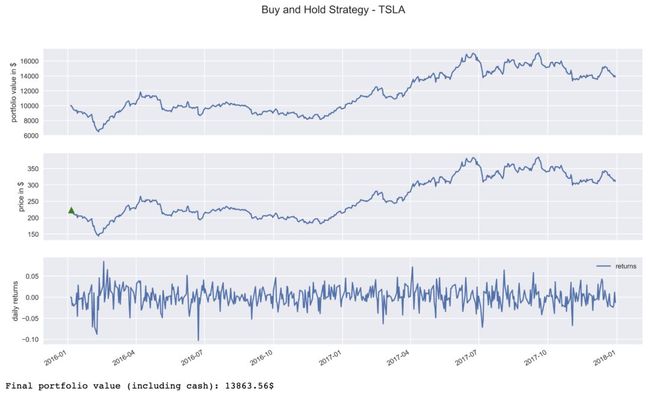
我们首先来看最基本的策略 —— 买入和持有。具体的思路是,我们买入一定的资产,在整个投资期间不进行任何操作。因此在投资第一天,我们使用全部本金尽可能多地购买 Tesla 的股票,接下来什么事情都不做。
这种简单的策略可以作为其他高级策略的基准,若某种复杂的策略相比于基准策略反而损失了更多的钱,那么说明这种策略毫无用处。
%%zipline --start 2016-1-1 --end 2017-12-31 --capital-base 10000.0 -o buy_and_hold.pkl
# imports
from zipline.api import order_percent, symbol, record
from zipline.finance import commission
# parameters
SELECTED_STOCK = 'TSLA'
def initialize(context):
context.asset = symbol(SELECTED_STOCK)
context.has_ordered = False
context.set_commission(commission.PerShare(cost=0.0, min_trade_cost=0))
def handle_data(context, data):
# trading logic
if not context.has_ordered:
order_percent(context.asset, 1)
context.has_ordered = True
record(price=data.current(context.asset, 'price'))
接下来,我们载入有关该策略表现的 DataFrame:
buy_and_hold_results = pd.read_pickle('buy_and_hold.pkl')
这里可能会出现 ending_cash 为负的情况,原因是我们想要买入的股份是当天收盘时计算的,于是使用的是收盘价格。然而,这笔交易是次日执行的,价格可能会发生大幅变化。在 zipline 中,交易不会因为金额不足而被拒,但我们可以通过负的余额将其终止。我们可以想些办法避免这种情况的发生,例如手动计算第二天要买入的股份,并考虑股价上涨等因素,以防止这种情况发生。
我们使用一个辅助函数,将该策略的细节进行可视化:投资组合的变化,交易价格序列,以及每天的收益情况。
我们还使用了另一个辅助函数来观察策略的表现,该函数将用于最后一部分:
buy_and_hold_results = pd.read_pickle('buy_and_hold.pkl')
为了简洁起见,我们不会展示每种策略的全部步骤,因为它们的执行方式都是一样的。
简单的移动平均策略
我们采用的第二种策略基于简单的移动平均数方法(SMA, Simple Moving Average)。该策略的逻辑可以归纳为以下几步:
-
当20天的 SMA 价格上升时,买入股份
-
当20天的 SMA 价格下降时,卖掉全部股份
-
用前19天和当天的数据计算移动平均数,次日执行交易决策
这是我们第一次调用预设辅助函数的地方,计算起始日期,以使投资者能在2016年的第一个交易日制定交易决策。
get_start_date('TSLA', '2016-01-04', 19)
# '2015-12-04'
在下面的策略中,我们使用修改后的日期作为起始日期:
%%zipline --start 2015-12-4 --end 2017-12-31 --capital-base 10000.0 -o simple_moving_average.pkl
# imports
from zipline.api import order_percent, record, symbol, order_target
from zipline.finance import commission
# parameters
MA_PERIODS = 20
SELECTED_STOCK = 'TSLA'
def initialize(context):
context.time = 0
context.asset = symbol(SELECTED_STOCK)
context.set_commission(commission.PerShare(cost=0.0, min_trade_cost=0))
context.has_position = False
def handle_data(context, data):
context.time += 1
record(time=context.time)
if context.time < MA_PERIODS:
return
price_history = data.history(context.asset, fields="price", bar_count=MA_PERIODS, frequency="1d")
ma = price_history.mean()
# cross up
if (price_history[-2] < ma) & (price_history[-1] > ma) & (not context.has_position):
order_percent(context.asset, 1.0)
context.has_position = True
# cross down
elif (price_history[-2] > ma) & (price_history[-1] < ma) & (context.has_position):
order_target(context.asset, 0)
context.has_position = False
record(price=data.current(context.asset, 'price'),
moving_average=ma)
注意:data.current(context.asset, ‘price’) 等同于 price_history[-1].
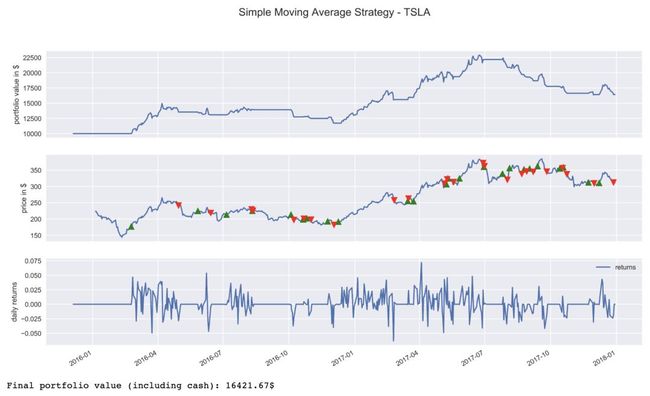
下图展示了该策略:
下图展示了20天的移动平均价格序列。我们还对每一次交易做了标注,即在记号之后的第一个交易日执行此笔交易。
移动平均交叉
移动平均交叉策略(Moving Average Crossover)可以看作是上一种策略的拓展版,用两个不同规格的移动窗口来代替单个的窗口。100天的移动平均数序列中,要隔很久才会出现价格的突变,而20天的移动平均数序列发生突变的速度要快很多。
该策略的逻辑如下:
-
当较快的移动平均值穿越较慢的移动平均值时,我们买入股份
-
当较慢的移动平均值穿越较快的移动平均值时,我们卖出股份
一定要记住一点,在这种策略中,许多不同长度窗口的组合构成了速度不同的移动平均数。
对于该策略,我们需要另外载入100天的数据,以便于准备 warm-up 阶段。
%%zipline --start 2015-8-11 --end 2017-12-31 --capital-base 10000.0 -o moving_average_crossover.pkl
# imports
from zipline.api import order_percent, record, symbol, order_target
from zipline.finance import commission
# parameters
SELECTED_STOCK = 'TSLA'
SLOW_MA_PERIODS = 100
FAST_MA_PERIODS = 20
def initialize(context):
context.time = 0
context.asset = symbol(SELECTED_STOCK)
context.set_commission(commission.PerShare(cost=0.0, min_trade_cost=0))
context.has_position = False
def handle_data(context, data):
context.time += 1
if context.time < SLOW_MA_PERIODS:
return
fast_ma = data.history(context.asset, 'price', bar_count=FAST_MA_PERIODS, frequency="1d").mean()
slow_ma = data.history(context.asset, 'price', bar_count=SLOW_MA_PERIODS, frequency="1d").mean()
# Trading logic
if (fast_ma > slow_ma) & (not context.has_position):
order_percent(context.asset, 1.0)
context.has_position = True
elif (fast_ma < slow_ma) & (context.has_position):
order_target(context.asset, 0)
context.has_position = False
record(price=data.current(context.asset, 'price'),
fast_ma=fast_ma,
slow_ma=slow_ma)
接下来,我们绘制了两个移动平均价格序列。我们可以发现,该策略产生的交易行为要比 SMA 策略少得多。
移动平均线收敛差异
MACD 的全称为 Moving Average Convergence/Divergence,即移动平均线收敛差异指标,是一种常用于股价技术分析中的指标。
MACD 由三个时间序列构成:
-
MACD 序列:快速(短期)和慢速(长期)的两个指数移动平均值的差值
-
信号序列:MACD 序列的 EMA(指数移动平均值)
-
差异序列:MACD 序列与信号序列之间的差值
MACD 的参数包括计算三个移动平均数的天数,即 MACD(a, b, c),参数 a 表示快速 EMA,b 表示慢速 EMA,c 表示 MACD 序列的 EMA。最常见的参数配置为 MACD(12, 26, 9),也是本文所采用的配置。若每周有6个工作日,这三个参数分别对应2个星期、1个月、1.5个星期。
必须记住一点,由于 MACD 是基于移动平均方法进行计算的,因此它是一种滞后指标。这就解释了为什么 MACD 在股市上的作用很小,它无法得出准确的价格趋势。
该策略的基本思想如下:
-
当 MACD 线穿越信号线向上时,买入股份
-
当 MACD 线穿越信号线向下时,卖出股份
和之前一样,为了准备 warm-up,我们要保证有34个历史数据值来计算 MACD:
%%zipline --start 2015-11-12 --end 2017-12-31 --capital-base 10000.0 -o macd.pkl
# imports ----
from zipline.api import order_target, record, symbol, set_commission, order_percent
import matplotlib.pyplot as plt
import talib as ta
from zipline.finance import commission
# parameters ----
SELECTED_STOCK = 'TSLA'
#initialize the strategy
def initialize(context):
context.time = 0
context.asset = symbol(SELECTED_STOCK)
context.set_commission(commission.PerShare(cost=0.0, min_trade_cost=0))
context.has_position = False
def handle_data(context, data):
context.time += 1
if context.time < 34:
return
price_history = data.history(context.asset, fields="price", bar_count=34, frequency="1d")
macd, macdsignal, macdhist = ta.MACD(price_history, 12, 26, 9)
if (macdsignal[-1] < macd[-1]) and (not context.has_position):
order_percent(context.asset, 1.0)
context.has_position = True
if (macdsignal[-1] > macd[-1]) and (context.has_position):
order_target(context.asset, 0)
context.has_position = False
record(macd = macd[-1], macdsignal = macdsignal[-1], macdhist = macdhist[-1], price=price_history[-1])
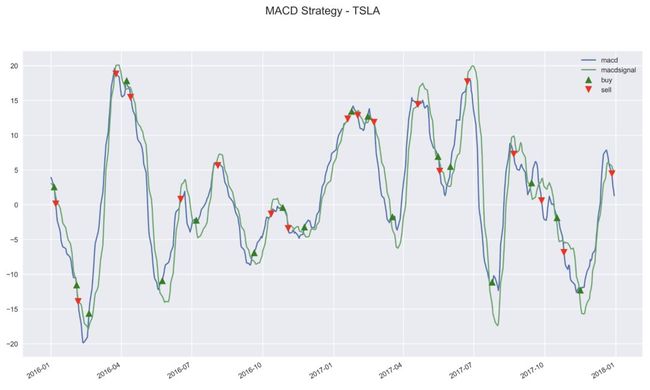
接下来,我们绘制了 MACD 线和信号线,交叉点代表买入/卖出的信号。另外,你也可以试着用直方图的形式来展现 MACD 差异。
相对强弱指标(RSI)
RSI 的全称为 Relative Strength Index,即相对强弱指标,也是一种用于创建交易策略的技术指标。RSI 被看作是一种动量振荡器,它可以估测价格变化的速度和幅度。
RSI 指标评估了股价的向上力量与向下力量的比率。若向上的力量较大,则计算出来的指标上升;若向下的力量较大,则指标下降。
RSI 的结果为0到100之间的数字,一般按14天进行计算。为生成交易信号,通常要指定 RSI 的下限为30,上限为70。也就是说,30以下在超卖区,70以上为超买区。
有时候,也可能会设定一个比较居中的值,比如在涉及到做空的策略中。我们也可以选择更极端的阈值,如20和80。不过,这要求具备专业知识,或者在回测时尝试。
这种策略的思想如下:
-
当 RSI 低于下限(30)时,买入股份
-
当 RSI 高于上限(70)时,卖出股份
%%zipline --start 2015-12-10 --end 2017-12-31 --capital-base 10000.0 -o rsi.pkl
# imports ----
from zipline.api import order_target, record, symbol, set_commission, order_percent
import matplotlib.pyplot as plt
import talib as ta
from zipline.finance import commission
# parameters ----
SELECTED_STOCK = 'TSLA'
UPPER = 70
LOWER = 30
RSI_PERIOD = 14
#initialize the strategy
def initialize(context):
context.time = 0
context.asset = symbol(SELECTED_STOCK)
context.set_commission(commission.PerShare(cost=0.0, min_trade_cost=0))
context.has_position = False
def handle_data(context, data):
context.time += 1
if context.time < RSI_PERIOD + 1:
return
price_history = data.history(context.asset, fields="price", bar_count=RSI_PERIOD+1, frequency="1d")
rsi = ta.RSI(price_history, timeperiod=RSI_PERIOD)
if rsi[-1] < LOWER and not context.has_position:
order_percent(context.asset, 1.0)
context.has_position = True
if rsi[-1] > UPPER and context.has_position:
order_target(context.asset, 0)
context.has_position = False
record(rsi=rsi[-1], price=price_history[-1], time=context.time)
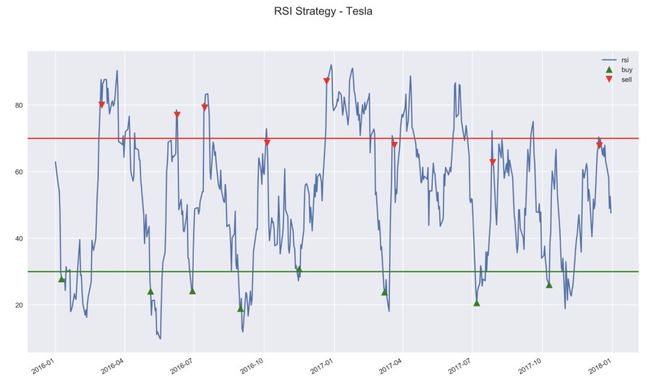
下图绘制了 RSI 指标和上、下限:
效果评估
最后一步,把所有的评估指标放入一个 DataFrame 中,然后观察其结果。我们会发现在回测时,基于简单移动平均方法的策略在收益方面表现最好,其夏普指数也最高,即在特定风险下,可获得的收益最高。基于 MACD 的策略排在第二位。只有这两种策略的表现超过了我们所设置的基准。
perf_df = pd.DataFrame({'Buy and Hold': buy_and_hold_perf,
'Simple Moving Average': sma_perf,
'Moving Average Crossover': mac_perf,
'MACD': macd_perf,
'RSI': rsi_perf})
perf_df.transpose()
(*本文为AI科技大本营编译文章,转载请微信联系 1092722531)
◆
精彩推荐
◆
2019 中国大数据技术大会(BDTC)再度来袭!豪华主席阵容及百位技术专家齐聚,15 场精选专题技术和行业论坛,超强干货+技术剖析+行业实践立体解读,深入解析热门技术在行业中的实践落地。6.6 折票限时特惠(立减1400元),学生票仅 599 元!


