a商品分析
import pandas as pd
# 读取2018a商品、b商品数据
data = pd.read_excel("1.xls")
data数据如下
| 日期 | 货物 | 价格 | |
|---|---|---|---|
| 0 | 2018.1.12 | a | 4.789700 |
| 1 | 2018.2.27 | a | 4.953795 |
| 2 | 2018.3.15 | a | 4.883900 |
| 3 | 2018.4.9 | a | 4.881400 |
| 4 | 2018.4.23 | a | 4.627900 |
| 5 | 2018.5.16 | a | 4.836900 |
| 6 | 2018.6.21 | a | 4.908300 |
| 7 | 2018.7.11 | a | 4.973100 |
| 8 | 2018.7.30 | a | 5.102200 |
| 9 | 2018.8.3 | a | 5.152300 |
| 10 | 2018.9.14 | a | 5.301900 |
| 11 | 2018.10.22 | a | 5.279800 |
| 12 | 2018.11.9 | a | 5.320900 |
| 13 | 2018.12.14 | a | 5.347573 |
| 14 | NaN | NaN | NaN |
| 15 | 2018.1.23 | b | 4.822800 |
| 16 | 2018.3.15 | b | 4.760900 |
| 17 | 2018.4.10 | b | 4.747000 |
| 18 | 2018.5.16 | b | 4.736600 |
| 19 | 2018.5.29 | b | 4.736600 |
| 20 | 2018.6.15 | b | 4.913300 |
| 21 | 2018.7.24 | b | 5.194900 |
| 22 | 2018.8.22 | b | 5.450000 |
| 23 | 2018.10.16 | b | 5.407600 |
| 24 | 2018.11.2 | b | 5.449500 |
| 25 | 2018.12.26 | b | 5.497700 |
# a商品数据
dataA = data.loc[data['货物']=='a']
# b商品数据
dataB = data.loc[data['货物']=='b']
# 2019a商品数据
dataA2 = pd.read_excel("2.xls")
以2018月1月1号为起始点,计算日期与起始点差距,除以30转化为月份数值
import datetime
dataA.loc[:,('days')]= dataA['日期'].apply(lambda x : (datetime.datetime.strptime(x,'%Y.%m.%d')-
                  datetime.datetime.strptime("2018.01.01", '%Y.%m.%d')).days/30+1)
dataA 2018a商品数据如下
| 日期 | 价格 | 月份 | |
|---|---|---|---|
| 0 | 2018.1.12 | 4.789700 | 1.366667 |
| 1 | 2018.2.27 | 4.953795 | 2.900000 |
| 2 | 2018.3.15 | 4.883900 | 3.433333 |
| 3 | 2018.4.9 | 4.881400 | 4.266667 |
| 4 | 2018.4.23 | 4.627900 | 4.733333 |
| 5 | 2018.5.16 | 4.836900 | 5.500000 |
| 6 | 2018.6.21 | 4.908300 | 6.700000 |
| 7 | 2018.7.11 | 4.973100 | 7.366667 |
| 8 | 2018.7.30 | 5.102200 | 8.000000 |
| 9 | 2018.8.3 | 5.152300 | 8.133333 |
| 10 | 2018.9.14 | 5.301900 | 9.533333 |
| 11 | 2018.10.22 | 5.279800 | 10.800000 |
| 12 | 2018.11.9 | 5.320900 | 11.400000 |
| 13 | 2018.12.14 | 5.347573 | 12.566667 |
import datetime
dataA2.loc[:,('days')]= dataA2['日期'].apply(lambda x : (x-
                  datetime.datetime.strptime("2018-01-01", '%Y-%m-%d')).days/30+1)
dataA2 2019a商品数据如下
| 日期 | 价格 | 月份 | |
|---|---|---|---|
| 0 | 2019-01-03 | 5.3029 | 13.233333 |
| 1 | 2019-02-07 | 4.9930 | 14.400000 |
| 2 | 2019-03-11 | 5.0019 | 15.466667 |
| 3 | 2019-04-10 | 4.8312 | 16.466667 |
| 4 | 2019-05-31 | 4.9661 | 18.166667 |
| 5 | 2019-06-13 | 5.0800 | 18.600000 |
| 6 | 2019-07-24 | 5.0981 | 19.966667 |
| 7 | 2019-08-15 | 5.2729 | 20.700000 |
| 8 | 2019-09-20 | 5.2920 | 21.900000 |
| 9 | 2019-10-15 | 5.3021 | 22.733333 |
| 10 | 2019-11-01 | 5.2337 | 23.300000 |
from pylab import mpl
import matplotlib.pyplot as plt
mpl.rcParams['font.sans-serif'] = ['SimHei']
#mpl.rcParams['font.sans-serif'] = ['Microsoft YaHei']    # 指定默认字体:解决plot不能显示中文问题
mpl.rcParams['axes.unicode_minus']=False
fig=plt.gcf()
fig.set_size_inches(18.5, 10.5)


plt.plot(dataA['日期'].apply(lambda x : (datetime.datetime.strptime(x,'%Y.%m.%d')))
                                        , dataA['价格'],  color='black', alpha=0.8,label="a商品2018")
plt.plot(dataA2['日期'], dataA2['价格'], color='red', alpha=0.8, label='a商品2019')
font1 = {'size': 25}
plt.legend(prop=font1)
plt.xlabel("月份",fontdict={'size': 20})
plt.tick_params(labelsize=23)
plt.ylabel("价格(元)",fontdict={'size': 20})
plt.title("a商品2018年与2019年价格走势图", fontdict={'size': 30})
plt.show()
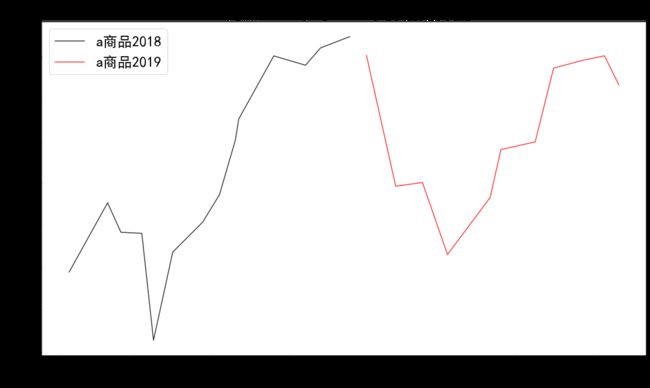
可见a商品2018年与2019年的价格走势,都反应了年初到月份价格走低趋势,4月份过后到年底价格回升走高,具有一定的周期性。
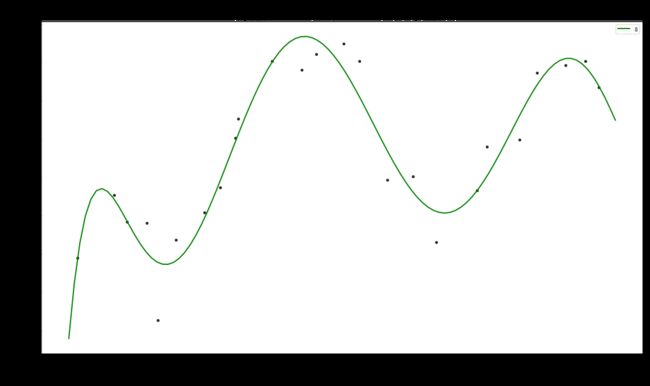
用多项式拟合a商品2018年与2019年价格曲线,8次多项式拟合效果最好
import numpy as np
from sklearn.pipeline import Pipeline
from sklearn.preprocessing import PolynomialFeatures
from sklearn import linear_model
import scipy as sp
from scipy.stats import norm
import matplotlib.pyplot as plt

""" 标准误差 """
def stdError_func(y_test, y):
    return np.sqrt(np.mean((y_test-y)**2))
def R2_1_func(y_test, y):
    return 1-((y_test-y)**2).sum() / ((y.mean() - y)**2).sum()
def R2_2_func(y_test, y):
    y_mean = np.array(y)
    y_mean[:] = y.mean()
    return 1 - stdError_func(y_test, y) / stdError_func(y_mean, y)

fig=plt.gcf()
fig.set_size_inches(18.5, 10.5)
x = dataA.loc[:,("days")].append(dataA2.loc[:,("days")])
y = dataA.loc[:,("价格")].append(dataA2.loc[:,("价格")])
plt.scatter(x,
            y, s=15, color='black',alpha=0.8)
#x = np.linspace(1,12,20)
degrees = [3,5,8,11]
for degree in degrees:
    clf = Pipeline([('poly', PolynomialFeatures(degree=degree)),
                   ('linear', linear_model.LinearRegression(fit_intercept=True))
                    #('linear', linear_model.RidgeCV())
                    #('linear', linear_model.Lasso())
                   ])
    clf.fit(x[:, np.newaxis],  y) ## 自变量需要二维数组
    predict_y =  clf.predict(x[:, np.newaxis])
    strError = stdError_func(predict_y, y)
    R2_1 = R2_1_func(predict_y, y)
    R2_2 = R2_2_func(predict_y, y)
    score = clf.score(x[:, np.newaxis], y) ##sklearn中自带的模型评估,与R2_1逻辑相同

    print ('degree={}: strError={:.2f}, R2_1={:.2f},  R2_2={:.2f}, clf.score={:.2f}'.format(
        degree, strError,R2_1,R2_2,score))
    print("11月15号价格%f"%clf.predict([[11.5]]))
    print("12月15号价格%f"%clf.predict([[12.5]]))
    x1 = np.linspace(0.99,24,100)

    predict_y1 =  clf.predict(x1[:, np.newaxis])
    plt.plot(x1, predict_y1, linewidth=2, label=degree, color='r')
plt.title("a商品2018年与2019年价格拟合",fontdict={'size': 30})
plt.xlabel("月份",fontdict={'size': 20})
plt.tick_params(labelsize=23)
plt.ylabel("价格(元)",fontdict={'size': 20})
plt.legend()
plt.show()
degree=3: strError=0.15, R2_1=0.46,  R2_2=0.26, clf.score=0.46
11月15号价格5.127768
12月15号价格5.125620
degree=5: strError=0.11, R2_1=0.69,  R2_2=0.45, clf.score=0.69
11月15号价格5.231734
12月15号价格5.197720
degree=8: strError=0.06, R2_1=0.92,  R2_2=0.71, clf.score=0.92
11月15号价格5.355355
12月15号价格5.286654
degree=11: strError=0.06, R2_1=0.90,  R2_2=0.68, clf.score=0.90
11月15号价格5.367262
12月15号价格5.291890
可见最高次8次拟合效果最好
degree=8: strError=0.06, R2_1=0.92, R2_2=0.71, clf.score=0.92
预测11月15号价格5.355355
预测12月15号价格5.286654
#x = np.linspace(0, 1, 500)
x = dataB.loc[:,("days")]
#y = norm.rvs(loc=0, size=500, scale=0.1) ##生成随机分布, 增加抖动(噪声)
#y = y + x**6
y = dataB.loc[:, ("价格")]
plt.scatter(x, y, s=5, color='black', alpha=0.8)
#x = np.linspace(1,12,20)
fig=plt.gcf()
fig.set_size_inches(18.5, 10.5)
degrees = [5]
for degree in degrees:
    clf = Pipeline([('poly', PolynomialFeatures(degree=degree)),
                   ('linear', linear_model.LinearRegression(fit_intercept=True))
                    #('linear', linear_model.RidgeCV())
                    #('linear', linear_model.Lasso())
                   ])
    clf.fit(x[:, np.newaxis],  y) ## 自变量需要二维数组
    predict_y =  clf.predict(x[:, np.newaxis])
    strError = stdError_func(predict_y, y)
    R2_1 = R2_1_func(predict_y, y)
    R2_2 = R2_2_func(predict_y, y)
    score = clf.score(x[:, np.newaxis], y) ##sklearn中自带的模型评估,与R2_1逻辑相同

    print ('degree={}: strError={:.2f}, R2_1={:.2f},  R2_2={:.2f}, clf.score={:.2f}'.format(
        degree, strError,R2_1,R2_2,score))

    x1 = np.linspace(1.01,12.99,200)
    predict_y1 =  clf.predict(x1[:, np.newaxis])
    print("2018年2月15号价格%f"%clf.predict([[2.5]]))
    print("2018年9月15号价格%f"%clf.predict([[9.5]]))
    plt.plot(x1, predict_y1, linewidth=2,c='r', label=degree)
plt.title("b商品2018年价格拟合",fontdict={'size': 30})
plt.xlabel("月份",fontdict={'size': 20})
plt.tick_params(labelsize=23)
plt.ylabel("价格(元)",fontdict={'size': 20})

plt.legend()
plt.show()
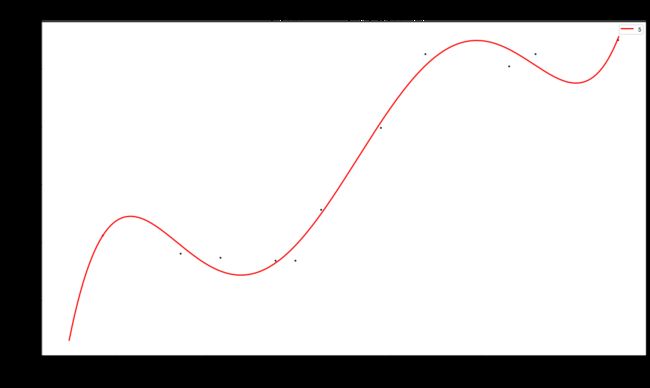
degree=5: strError=0.03, R2_1=0.99, R2_2=0.89, clf.score=0.99
2018年2月15号价格4.885876
2018年9月15号价格5.485014


