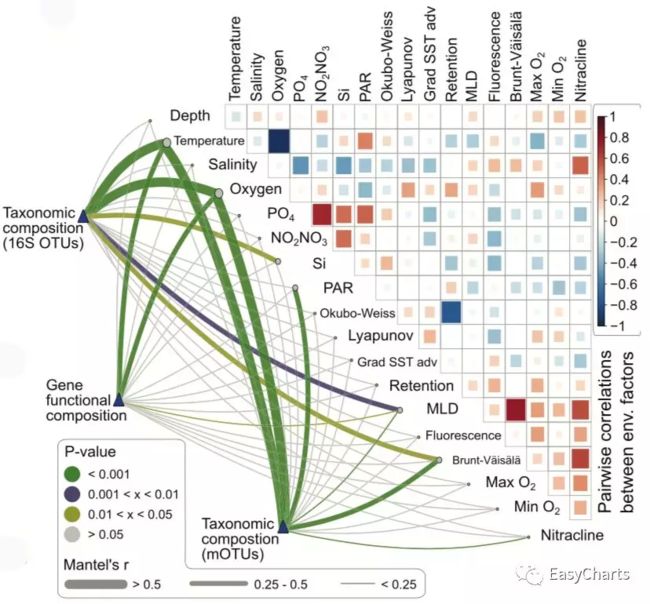
是不是看到这种图心里痒痒的,三年了,终于有人把它重现出来了。
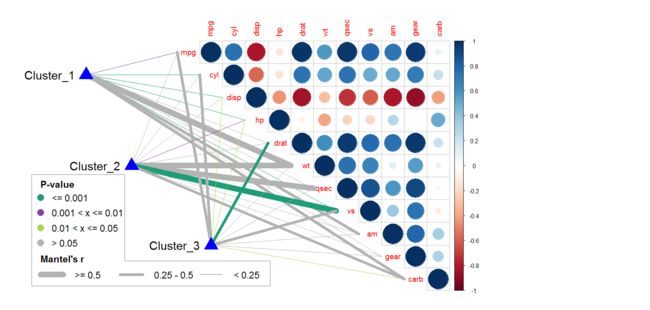
从原图我们很容易发现,主要有三部分:右上角是类似于corrplot包中的上三角相关系数图;下三角是一组点之间的连接线(作者用了弧线,直线也能达到同样的效果);剩余部分主要是图例等其它辅助绘图元素。
R语言才是最好的拼图软件,只要你愿意花时间。时间来到这个历史节点上,就是这个图已经有人做出来了,而且,以你残缺的R基础也已经重新在自己电脑上重新绘制出来(尽管是在单身的学长的帮助下)。那么,这个图里面的点线面及其颜色各代表什么实际的生物学或者社会学的意义,它在讲诉一个怎样的故事?花瓶型还是内涵型?
library(vegan)
library(dplyr)
library(corrplot)
par(omi = c(0.3, 0.3, 0.3, 0.3),
    cex = 1.2,
    family = 'Times New Roman') # windows系统可能需要安装其他字体包
M <- cor(decostand(mtcars,method="hellinger",na.rm=T))#计算相关系数矩阵
corrplot(M, method = "circle", type = 'upper')
head(mtcars)
                   mpg cyl disp  hp drat    wt  qsec vs am gear carb
Mazda RX4         21.0   6  160 110 3.90 2.620 16.46  0  1    4    4
Mazda RX4 Wag     21.0   6  160 110 3.90 2.875 17.02  0  1    4    4
Datsun 710        22.8   4  108  93 3.85 2.320 18.61  1  1    4    1
Hornet 4 Drive    21.4   6  258 110 3.08 3.215 19.44  1  0    3    1
Hornet Sportabout 18.7   8  360 175 3.15 3.440 17.02  0  0    3    2
Valiant           18.1   6  225 105 2.76 3.460 20.22  1  0    3    1
# 准备数据
set.seed(20190420)
n <- ncol(mtcars)
grp <- c('Cluster_1', 'Cluster_2', 'Cluster_3') # 分组名称
sp <- c(rep(0.0008, 6), rep(0.007, 2), rep(0.03, 3), rep(0.13, 22)) # P值
gx <- c(-4.5, -2.5, 1) # 分组的X坐标
gy <- c(n-1, n-5, 2.5) # 分组的Y坐标
df <- data.frame(
  grp = rep(grp, each = n), # 分组名称,每个重复n次
  gx = rep(gx, each = n), # 组X坐标,每个重复n次
  gy = rep(gy, each = n), # 组Y坐标,每个重复n次
  x = rep(0:(n - 1) - 0.5, 3), # 变量连接点X坐标
  y = rep(n:1, 3), # 变量连接点Y坐标
  p = sample(sp), # 对人工生成p值进行随机抽样
  r = sample(c(rep(0.8, 4), rep(0.31, 7), rep(0.12, 22)))
  # 对人工生成r值进行随机抽样
)

length(rep(grp, each = n))
length(rep(gx, each = n))
length(rep(gy, each = n))
length(rep(0:(n - 1) - 0.5, 3))
length(rep(n:1, 3))
length(sample(sp))
length(sample(c(rep(0.8, 4), rep(0.31, 7), rep(0.12, 22))) )

# 这一部分代码是按照原图图例说明处理线条宽度和颜色映射
df <- df %>%
  mutate(
    lcol = ifelse(p <= 0.001, '#1B9E77', NA),
    # p值小于0.001时,颜色为绿色,下面依次类推
    lcol = ifelse(p > 0.001 & p <= 0.01, '#88419D', lcol),
    lcol = ifelse(p > 0.01 & p <= 0.05, '#A6D854', lcol),
    lcol = ifelse(p > 0.05, '#B3B3B3', lcol),
    lwd = ifelse(r >= 0.5, 14, NA),
    # r >= 0.5 时,线性宽度为14,下面依次类推
    lwd = ifelse(r >= 0.25 & r < 0.5, 7, lwd),
    lwd = ifelse(r < 0.25, 1, lwd)
  )
核心函数:segments。
segments(df$gx, df$gy, df$x, df$y, lty = 'solid', lwd = df$lwd,
         col = df$lcol, xpd = TRUE) # 绘制连接线

points(gx, gy, pch = 24, col = 'blue', bg = 'blue', cex = 3, xpd = TRUE)
# 组标记点
text(gx - 0.5, gy, labels = grp, adj = c(1, 0.5), cex = 1.5, xpd = TRUE)
# 组名称

labels01 <- c('<= 0.001','0.001 < x <= 0.01','0.01 < x <= 0.05','> 0.05')
labels02 <- c('>= 0.5', '0.25 - 0.5', '< 0.25')
labels_x <- rep(-6, 4)
labels_y <- seq(4.6, 2.6, length.out = 4)
text(-6.5, 5.2, 'P-value', adj = c(0, 0.5), cex = 1.2, font = 2, xpd = TRUE)
text(labels_x, labels_y, labels01, adj = c(0, 0.5), cex = 1.2, xpd = TRUE)
points(labels_x - 0.5, labels_y, pch = 20, col = c('#1B9E77', '#88419D','#A6D854', '#B3B3B3'),
       cex = 3, xpd = TRUE)
lines_x <- c(-6.5, -3, 0.5)
lines_y <- rep(1.2, 3)
text(-6.5, 1.9, "Mantel's r", adj = c(0, 0.5), cex = 1.2, font = 2, xpd = TRUE)
text(lines_x + 1.5, lines_y, labels02, adj = c(0, 0.5), cex = 1.2, xpd = TRUE)
segments(lines_x, lines_y, lines_x + 1, lines_y, lwd = c(14, 7, 2.5), lty = 'solid',
         col = '#B3B3B3', xpd = TRUE)
图例框框
## 图例框框
segments(-6.9, 5.6, -2.8, 5.6, lty = 'solid', lwd = 1.2,
         col = 'grey50', xpd = TRUE)
segments(-2.8, 5.6, -2.8, 1.8, lty = 'solid', lwd = 1.2,
         col = 'grey50', xpd = TRUE)
segments(-2.8, 1.8, 3.6, 1.8, lty = 'solid', lwd = 1.2,
         col = 'grey50', xpd = TRUE)
segments(3.6, 1.8, 3.6, 0.7, lty = 'solid', lwd = 1.2,
         col = 'grey50', xpd = TRUE)
segments(3.6, 0.7, -6.9, 0.7, lty = 'solid', lwd = 1.2,
         col = 'grey50', xpd = TRUE)
segments(-6.9, 0.7, -6.9, 5.6, lty = 'solid', lwd = 1.2,
         col = 'grey50', xpd = TRUE)
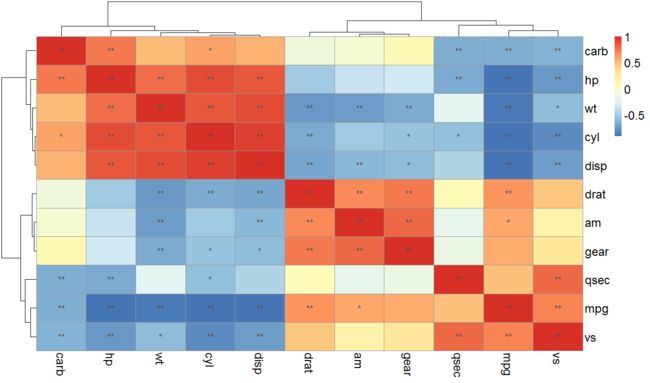
这张图不过是相关系数的展现形式的一种创新,炫的地方在与下面的几条线。那么,我们不禁要问,这种形式的图和pheatmap按照p值标签的图有什么本质的区别吗?
library(pheatmap)
library(psych)
?pheatmap
?psych

pr<-corr.test(mtcars,mtcars,method="spearman")
pheatmap(pr$r,display_numbers = matrix(ifelse(pr$p <= 0.01, "**", ifelse(pr$p<= 0.05 ,"*"," ")), nrow(pr$p)),fontsize=18)
R语言之照猫画虎2


