本系列笔记主要基于《深入理解Java虚拟机:JVM高级特性与最佳实践 第2版》,是这本书的读书笔记。
jmap 命令用来生成内存堆转储快照,一般称为heapdump或dump文件。
除了使用 jmap 命令,还以通过一些JVM参数让虚拟机在内存溢出时自动dump出快照文件。
| 参数 | 说明 |
|---|---|
| -XX:+HeapDumpOnOutOfMemoryError | 内存溢出时自动导出内存快照 |
| -XX:HeapDumpPath=E:/dumps/ | 导出内存快照时保存的路径 |
所有的JDK工具都可以在Oracle官网的 Java Tools Reference 文档中找到使用说明,这是主要参考,包括命令格式、参数内容、输出信息等等。
jmap 命令格式:
jmap [ options ] pid
jmap [ options ] executable core
jmap [ options ] [ pid ] server-id@ ] remote-hostname-or-IP
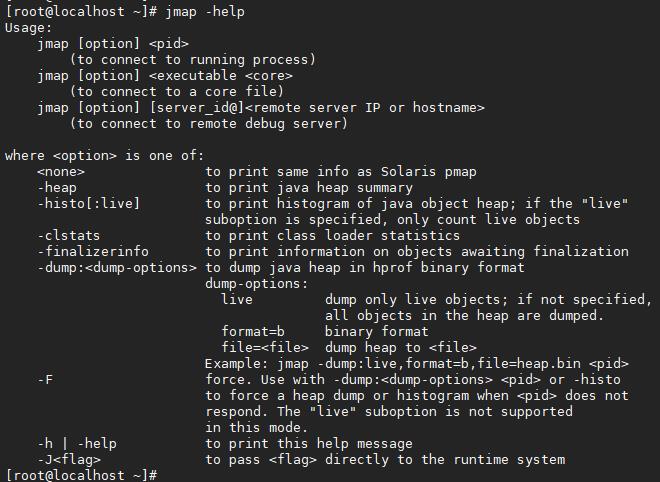
jmap 帮助信息:
jmap -dump
jmap 命令使用-dump参数生成内存快照,-dump参数格式如下:
-dump:[live,] format=b, file=filename举例如下:
jmap -dump:format=b,file=/dumps/jmap.hprof 21060输出如下:
可见,在指定目录dumps下面生成了堆快照文件。
jmap -heap
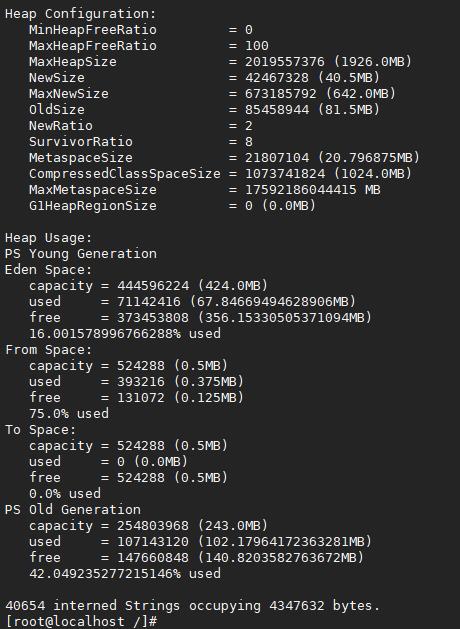
jmap 命令使用-heap参数查看堆内存的配置信息,以及堆中各个区域的使用情况,如新生代的Eden和Survivor区,还有老年代。
-heap参数举例如下:
jmap -heap 21060输出如下:
其他参数
jmap 命令还有很多其他参数,可以参考 Java Tools Reference 文档,列举如下:
    When no option is used, the jmap command prints shared object mappings. For each shared object loaded in the target JVM, the start address, size of the mapping, and the full path of the shared object file are printed. This behavior is similar to the Oracle Solaris pmap utility.

-dump:[live,] format=b, file=filename
    Dumps the Java heap in hprof binary format to filename. The live suboption is optional, but when specified, only the active objects in the heap are dumped. To browse the heap dump, you can use the jhat(1) command to read the generated file.

-finalizerinfo
    Prints information about objects that are awaiting finalization.

-heap
    Prints a heap summary of the garbage collection used, the head configuration, and generation-wise heap usage. In addition, the number and size of interned Strings are printed.

-histo[:live]
    Prints a histogram of the heap. For each Java class, the number of objects, memory size in bytes, and the fully qualified class names are printed. The JVM internal class names are printed with an asterisk (*) prefix. If the live suboption is specified, then only active objects are counted.

-clstats
    Prints class loader wise statistics of Java heap. For each class loader, its name, how active it is, address, parent class loader, and the number and size of classes it has loaded are printed.

-F
    Force. Use this option with the jmap -dump or jmap -histo option when the pid does not respond. The live suboption is not supported in this mode.

-h
    Prints a help message.

-help
    Prints a help message.

-Jflag
Passes flag to the Java Virtual Machine where the jmap command is running. 

