在之前的折线制作过程中,我们选择使用的平滑曲线,这一节我们学习一下带锚点的折线图配合区域图的制作方法。
准备的数据
const  line0_data = [
  {
      type: "历史平均",
      value: [
              ['2016/07', 1.4],
              ['2016/08', 1.5],
              ['2016/09', 1.8],
              ['2016/10', 1.9],
              ['2016/11', 1.6],
              ['2016/12', 2.5],
              ['2017/01', 2.1],
              ['2017/02', 2.6],
              ['2017/03', 2.4],
              ['2017/04', 2.7]
           ]
  },
  {
      type: "行业平均",
      value: [
            ['2016/07', 1],
            ['2016/08', 1.3],
            ['2016/09', 1.2],
            ['2016/10', 1.7],
            ['2016/11', 1.4],
            ['2016/12', 2.2],
            ['2017/01', 2.1],
            ['2017/02', 2.4],
            ['2017/03', 2.0],
            ['2017/04', 1.8]
           ]
  },
  {
    type: "当前商品",
    value: [
          ['2016/07', 1.2],
          ['2016/08', 1.4],
          ['2016/09', 1.8],
          ['2016/10', 1.9],
          ['2016/11', 1.8],
          ['2016/12', 2.4],
          ['2017/01', 2.1],
          ['2017/02', 2.1],
          ['2017/03', 2.0],
          ['2017/04', 1.4]
         ]
}

]
绘制折线图及图例
上一节这部分已经详细介绍过,这里我们直接上代码,有问题的同学可以参考深入浅出数据可视化之道(5)
js部分
 const data = line0_data;

    var initWidth = 340
    var initHeight = 500

    var padding = { left:40, top:20, right:20, bottom: 40}

    var height = initWidth - padding.top - padding.bottom
    var width  = initHeight - padding.left - padding.right


    var svg = d3.select("body")
                .append("svg")
                .attr("id", "chart")
                .attr("width", width)
                .attr("height", height)
                .style("padding-left", padding.left)
                .style("padding-right", padding.right)
                .style("padding-top", padding.top)
                .style("padding-bottom", padding.bottom)


     //添加y轴坐标轴

        //y轴比例尺
        let nums = [...data[0]["value"], ...data[1]["value"]].map(function(e){
            return e[1]
        })
        let yScale = d3.scaleLinear()
         .domain([0, d3.max(nums)*1.5])
         .range([height , 0]);

         let _yScale = d3.scaleLinear()
         .domain([0, d3.max(nums)*1.5])
         .range([0, height]);

        //定义y轴
        let yAxis = d3.axisLeft(yScale).ticks(6).tickSize(0.5);

        //添加y轴
        svg.append("g")
        .attr("class","axis")
        .attr("transform","translate(" + 0 + "," + 0 + ")")
        .call(yAxis);

     //添加x轴坐标轴

         //x轴比例尺
         let years = data[0]["value"].map(function(e){
                    return e[0]
          })

         const step = width / years.length

         let xScale = d3.scaleBand()
                        .domain(years)
                        .rangeRound([0, width])


        let _xScale =  d3.scaleBand()
                       .domain([0, width])
                       .rangeRound(years)

        //定义x轴
        let xAxis = d3.axisBottom(xScale).ticks(0)

        //添加x轴
         svg.append("g")
            .attr("class","axis-x")
            .attr("transform","translate(" + "0 ," + height + ")")
            .call(xAxis);


        //添加
       // gridlines in y axis function
       function make_y_gridlines() {
        return d3.axisLeft(yScale)
            .ticks(6)
    }


          // add the Y gridlines
        var grid =  svg.append("g")
            .attr("id", "grid")
            .call(make_y_gridlines()
                .tickSize(-width)
                .tickFormat("")
            )
        //--------------以下是绘制图形-------------

        //创建一个直线生成器
        var linePath = d3.line()
                         .x( function(d){ return xScale(d[0]) + step/2 })
                         .y( function(d){ return yScale(d[1])})


        var colors = ["rgb(0, 188, 212)", "rgb(255, 64, 129)", '#955694']


        //添加路径
        svg.append("g").selectAll("path")
            .data(data)
            .enter()
            .append("path")
            .attr("transform","translate(0, 0)")
            .attr("d", function(d){
                return linePath(d.value)
            })
            .attr("fill", "none")
            .attr("stroke-width", "2px")
            .attr("stroke", function(d, i){
              return colors[i]
            })

        // 添加节点
        var circles = svg.append("g")
                        .selectAll("g")
                        .data(data)
                        .enter()
                        .append("g")
                        .attr("class", function(d,i){return d.type})

          circles.selectAll("circle")
              .data(function(d){
                 return d.value
              })
              .enter()
              .append("circle")
              .attr("cx", function(d){
                 return xScale(d[0]) + step/2
                })
              .attr("cy", function(d){
                 return height - _yScale(d[1])
               })
              .attr("r", 4)
              .attr("fill", function(d, i){
                 var type = d3.select(d3.select(this)._groups[0][0].parentNode).attr("class")
                 var ii = data.findIndex((val, index) =>{
                            return val.type == type
                         }
                        )
                return colors[ii]
              })

        var cover =svg.append("g")

            cover.selectAll("rect")
                .data(data)
                .enter()
                .append("rect")
                .attr("width", 10)
                .attr("height", 10)
                .attr("fill", function(d, i){
                  return colors[i]
                })
                .attr("transform", function(d, i){
                    return `translate(10, ${(i)*20})`
                })


            cover.selectAll("text")
                  .data(data)
                  .enter()
                  .append("text")
                  .text(function(d, i){
                    return d.type
                  })
                  .attr("transform", function(d, i){
                      return `translate(27, ${(i)*20})`
                  })
                  .attr("font-size", '12px')
                  .attr("dy",function(){
                    return '0.75em'
                  })
                  .attr("fill", function(){
                    return '#333'
                  })

       // 偏移文字
       d3.selectAll('.axis-x .tick text')
         .attr("dy",'1em')
         .attr('dx', '-2em')
style部分
  body{
      font-family: "helvetica";
      background-color: #fff;
      margin:0;
      padding:100px
    }

    svg {
        box-sizing: content-box
    }

    .axis path {
        display: none;
    }
    .axis .tick line{
        opacity: 0
    }
    .axis-x path {
        stroke: #aaa;
        stroke-width: 1
    }
    .axis-x .tick line{
        stroke: #aaa;
        stroke-width: 1
    }
    .axis-x .tick text{
        transform: rotate(-30deg);
    }

    #grid line {
      stroke: #aaa;
      stroke-width: 1
    }
    #grid .tick:nth-child(2) {
      display: none
    }
    #grid path {
      display: none
    }
    .line_y .domain{
        stroke: yellow;
        stroke-width: 2
    }
实现的效果
生成区域
这里我们将学习一个新的生成器,区域生成器
首先我们先了解一下基本概念:
区域生成器主要是生成一块区域,类似于直线生成器。
其数据访问器有x().x0().x1().y().y0().y1()这几项,数量比较多但是不需要同时都使用
一个简单的区域图
 const data = [80, 90, 120, 110, 180, 220]
 var areaPath = d3.area()
                     .x(function(d,i){return 20+i*70})
                     .y0(function(d, i){return height})
                     .y1(function(d,i){return height - d})

   var area= svg.append("path")
                    .attr("d", areaPath(data) )
                    .attr('fill', "rgba(0,0,255,0.4)")
生成的效果
结合图示:
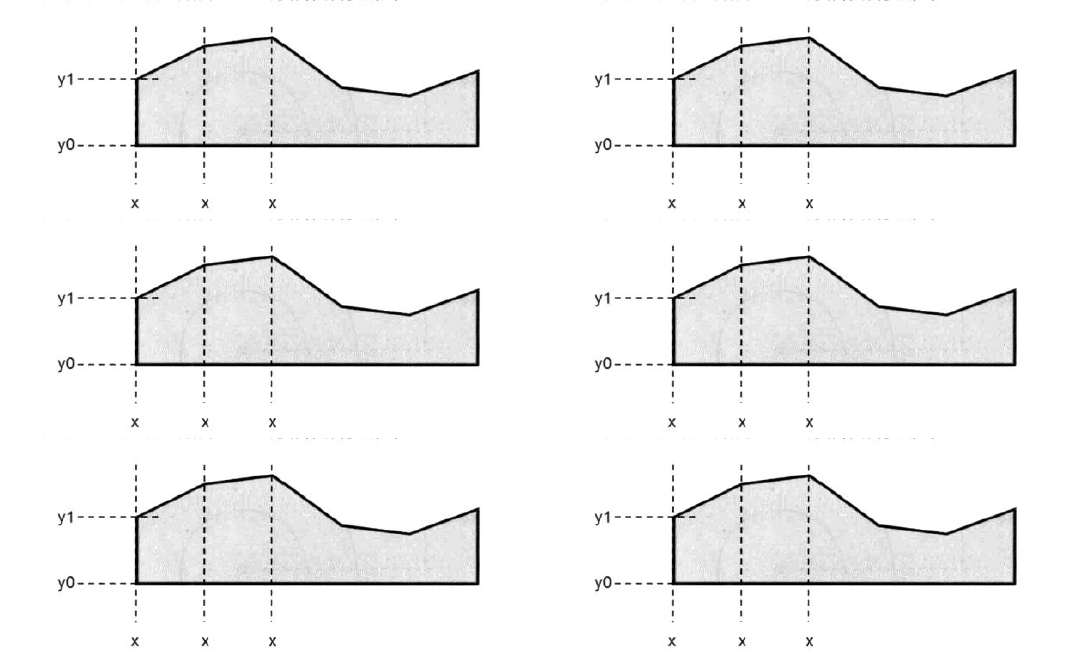
这里我们添加的是x轴方向的区域图,因此x只需取一个值即可。如图示,y0代表区域图节点底部坐标,y1代表区域图节点顶部坐标。区域图通过一个个类似‘节点线’的东西构成了一个完整的面积图。
给折线图添加区域图
 //生成河流的数据
       const max_min = [
            ['2016/07', 0.4, 2.0],
            ['2016/08', 1.0, 1.8],
            ['2016/09', 1.1, 2.2],
            ['2016/11', 1.2, 2.4],
            ['2016/12', 2.0, 2.7],
            ['2017/01', 1.5, 2.5],
            ['2017/02', 1.9, 3.1],
            ['2017/03', 1.5, 3.0],
            ['2017/04', 1.0, 3.2]
        ]
// 添加区域图
        var areaPath = d3.area()
                          .x(function(d){ return xScale(d[0]) + step/2 })
                          .y0(function(d){  return yScale(d[2]) })
                          .y1(function(d){  return yScale(d[1]) })

        var river = svg.append("path")
                        .attr("d", areaPath(max_min) )
                        .attr('fill', "rgba(0,0,255,0.2)")
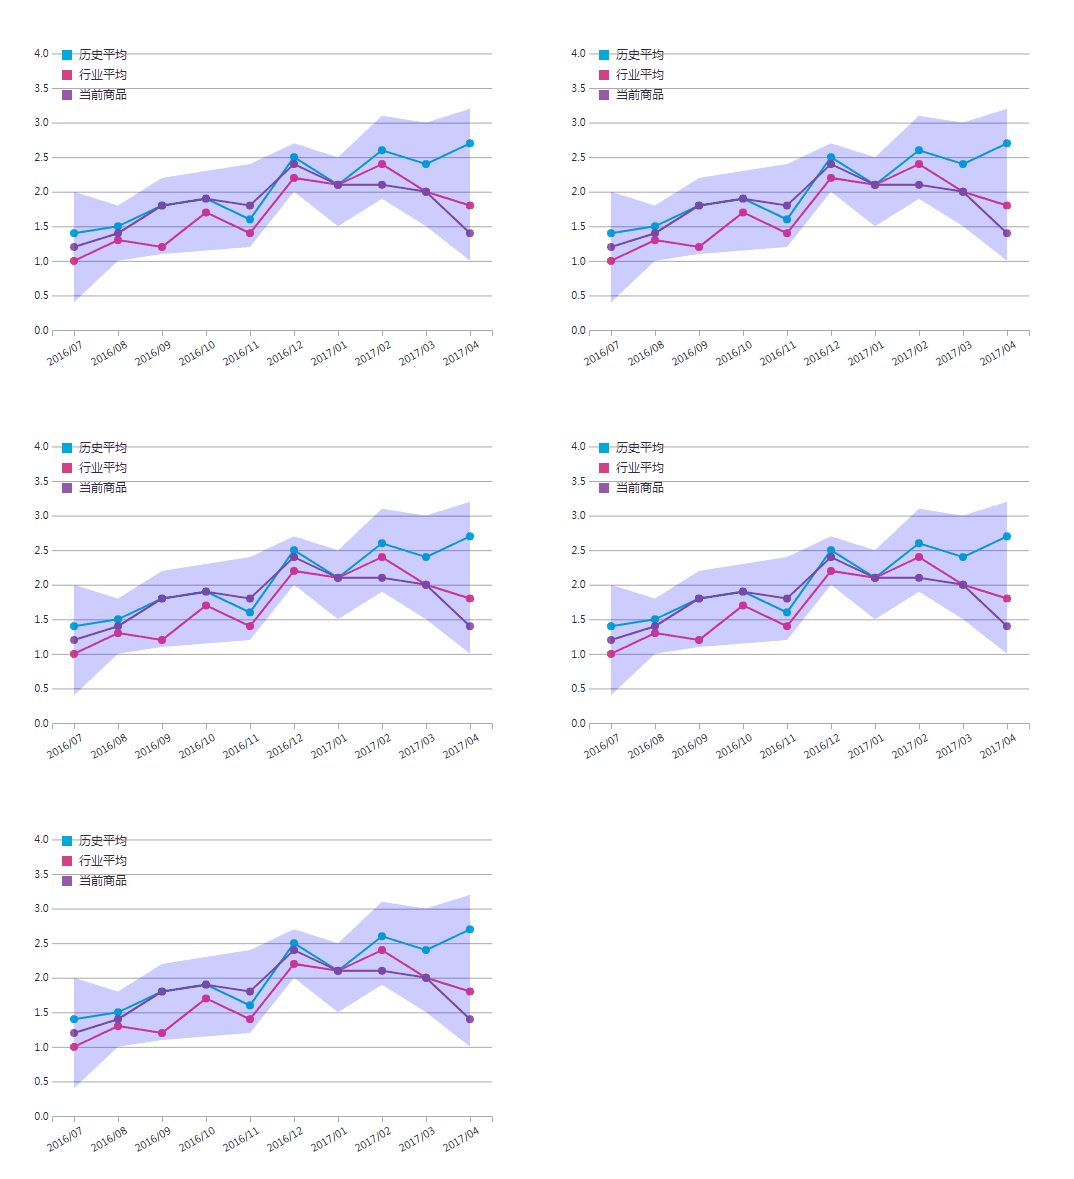
最终生成的效果
源码地址


