昨天浏览kaggle的时候发现了两个关于世界杯的数据分析案例,非常非常有意思,第一个https://www.kaggle.com/pavanraj159/fifa-world-cup-1930-to-2014-data-analysis (FIFA World Cup (1930 to 2017)-Data analysis)主要内容是探索1930年到2014年世界杯的历史数据,这个应该可以作为正在学习数据分析的逐渐喜欢上足球的我入门世界杯的最好的学习材料了。当然得仔细学习啦!
第二个https://www.kaggle.com/justjun0321/fifa-may-the-force-be-with-the-strongest-team (FIFA-May the force be with the strongest team (脑海里突然出现了《大笑江湖》里赵本山老师那句东北味十足的May the force be with you))。主要内容是根据各支球队历史对阵数据来预测晋级淘汰赛的16支队伍,看了预测结果,除了德国(Germany)和波兰(Poland),其他14支队伍全部预测正确(14 out of 16 are right),这份可以作为了解足球各项统计数据的进阶学习材料。也要仔细学习。
这篇文字的内容主要记录第一个案例的重复过程
新球迷了解世界杯知识点1:首届世界杯1930年(since the inaugural tournament in 1930);1942,1946因为第二次世界大战(the Second World War)中断两届。
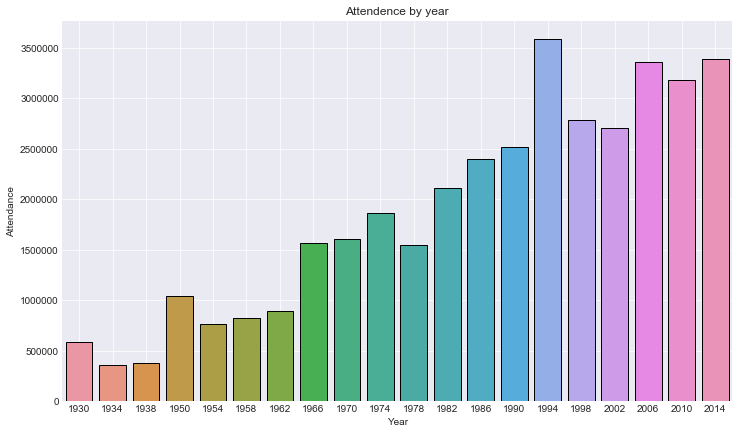
1、 先来看一下每届世界杯观众的数量
import os
import pandas as pd
import seaborn as sns
import matplotlib.pyplot as plt
matches = pd.read_csv(r"../../kaggle_practice/WorldCupMatches.csv")
matches.isnull().sum()
sns.set_style("darkgrid")
matches = matches.drop_duplicates(subset="MatchID",keep="first")
matches = matches[matches["Year"].notnull()]
att = matches.groupby("Year")["Attendance"].sum().reset_index()
att["Year"] = att["Year"].astype(int)
plt.figure(figszie=(12,7))
sns.barplot(att["Year"],att["Attendance"],linewidth=1,edgecolor="k"*len(att))
plt.grid(True)
plt.title("Attendence by year")
plt.show()
#以下函数的用法暂时不太清楚,自己随意制作一份数据看一下以下函数的输出结果
isnull()
isnull().sum()
notnull()
groupby()
reset_index()
数据
| AAA | BBB | CCC | DDD |
|---|---|---|---|
| 1 | 5 | 2 | 9 |
| 2 | 4 | 9 | |
| 3 | 5 | 5 | |
| 4 | 3 | 3 | 7 |
| 5 | 2 | 4 | 3 |
practice = pd.read_csv("../../kaggle_practice/pandas_practice.csv")
practice.head()
practice.isnull() # isnull()函数判断表格中每个位置是否为缺失值,缺失值返回True,否则返回False
practice.isnull().sum()#返回结果为每列缺失值的个数
practice["BBB"].notnull()#指定某一列判断缺失值,缺失值返回False,否则返回True
practice[practice['BBB'].notnull()]#挑选出中括号内为True所在的行,和R里面数据框的操作还挺像的
practice.groupby("AAA")#groupby()函数暂时还没有搞懂用法;R里面的group_by()函数也不会用
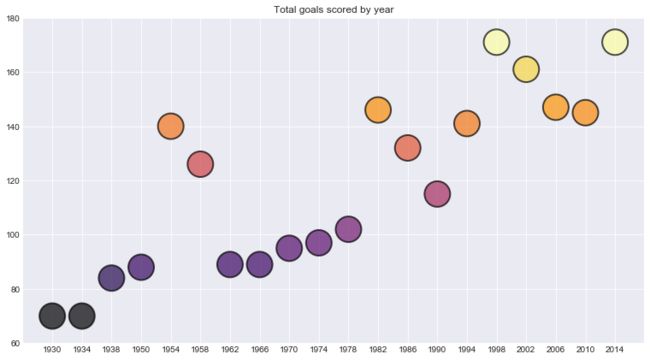
2、每届世界杯总共的进球数(Total goals scored by year)
cups = pd.read_csv("../../kaggle_practice/WorldCups.csv")
plt.figure(figsize=(13,7))
cups["Year1"] = cups["Year"].astype(str)
ax = plt.scatter("Year1","GoalsScored",data=cups.c=cups["GoalsScored"],cmap="inferno",s=900,alpha=0.7,linewidth=2,edgecolor="k")
plt.xticks(cups["Year1"].unique())
plt.yticks(np.arange(60,200,20))
plt.title('Total goals scored by year')
plt.show()
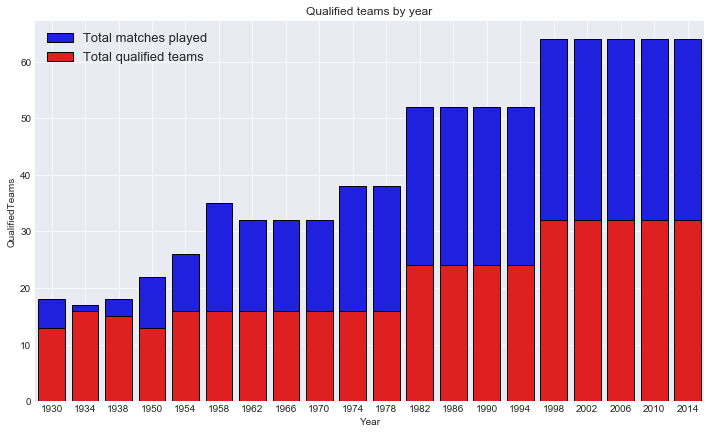
3、比赛场次和参赛队伍的数量(Total matches played and qualified teams by year)
新球迷了解世界杯知识点2:1934到1978年间除了1938年和1950年均有16支球队参加世界杯;1938年是15支球队因为Austria(奥地利(第一反应是澳大利亚,还得好好学英语呀!)) was absorbed into Germany after qualifying(世界历史还得仔细了解一下);1950年13支球队参加比赛因为India, Scotland(苏格兰), and Turkey withdrew(这个withdraw如何理解呢?)
plt.figure(figsize=(12,7))
sns.barplot(cups["Year"],cups["MatchesPlayed"],linewidth=1,edgecolor="k"*len(cups),color="b",label="Total matches played")
sns.barplot(cups["Year"],cups["QualifiedTeams"],linewidth=1,edgecolor="k"*len(cups),color="r",label="Total qualified teams")
plt.legend(loc="best",prop={"size":13})
plt.title("Qualified teams by year")
plt.grid(True)
plt.show()
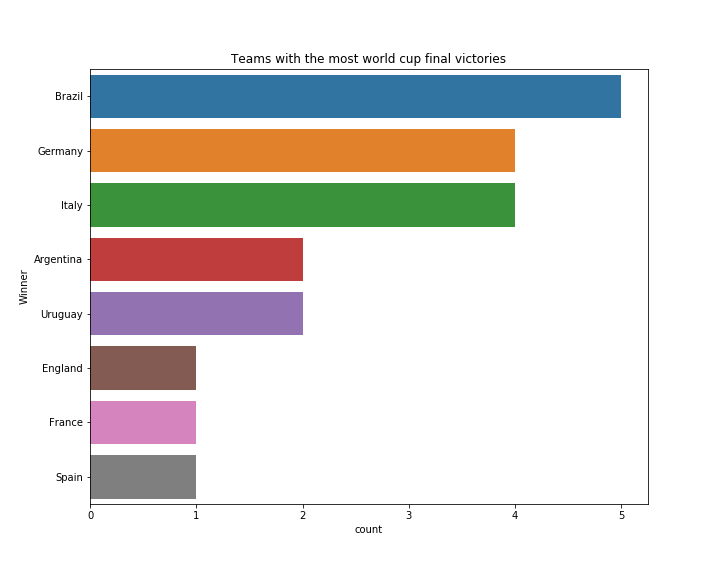
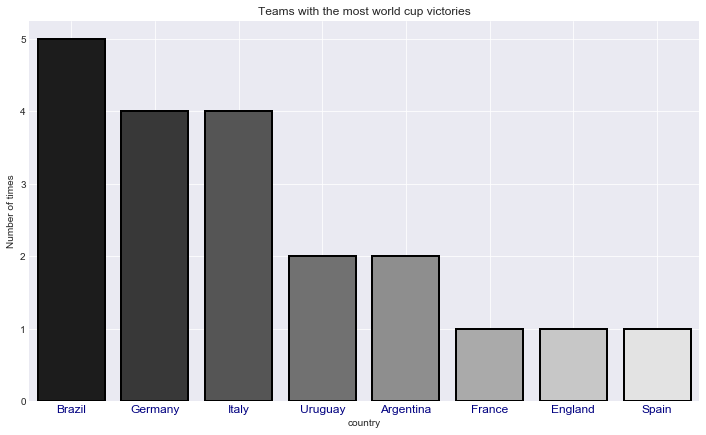
4、赢得过世界杯冠军最多的国家(Teams with the most world cup final victories)
新球迷了解世界杯知识点3:目前有8支球队赢得过世界杯冠军。巴西得过5次世界杯冠军,也是唯一一支参加过每一届世界杯的球队,德国和意大利各得过四次冠军,Argentina(阿根廷)和Uruguay(乌拉圭)得过两次冠军,英格兰,法国和西班牙各得过一次冠军(with one title each)
cups["Winner"]=cups["Winner"].replace("Germany FR","Germany")
cups["Runners-Up"]=cups["Runners-Up"].replace("Germany FR","Germany")
cou = cups["Winner"].value_counts().reset_index()

plt.figure(figsize=(12,7))
sns.barplot("index","Winner",data=cou,palette="binary_r",
            linewidth=2,edgecolor="k"*len(cou))
plt.grid(True)
plt.ylabel("Number of times")
plt.xlabel("country")
plt.title("Teams with the most world cup victories")
plt.xticks(color="navy",fontsize=12)
plt.show()
后面还有好多好多的知识点,抽时间再来学习补充!
更新 20180721
每届世界杯平均观众数量
import os
import pandas as pd
import seaborn as sns
import matplotlib.pyplot as plt
os.chdir("Python_practice/kaggle_practice")
matches = pd.read_csv(r"WorldCupMatches.csv")
matches.head()
att1 = matches.groupby("Year")["Attendance"].mean().reset_index()
att1["Year"] = att1["Year"].astype(int)
plt.figure(figsize=(12,7))
ax = sns.pointplot(att1["Year"],arr1["Attendance"],color='w')
ax.set_facecolor("k")
plt.grid(True,color="grey",alpha=0.3)
plt.title("Average attendence by year",color='b')
plt.show()
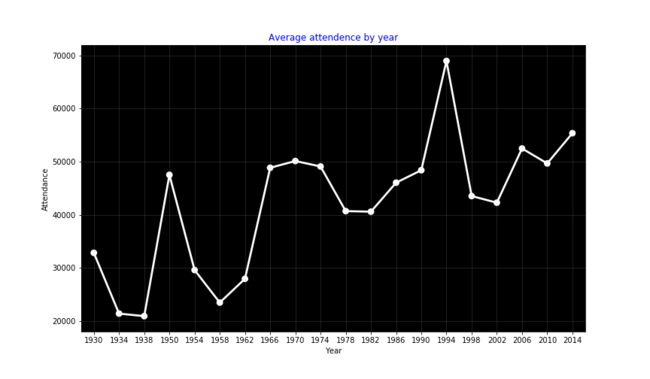
小知识点:1994年美国世界杯平均观众数量最多,平均每场比赛观众人数为 68991
疑问?groupby()函数的作用,暂时还没有搞明白,R里面dplyr包也有这个函数group_by(),也没有看懂作用是什么
举办世界杯比赛最多的城市
mat_c = matches["City"].value_counts().reset_index()
plt.figure(figsize=(10,8))
ax = sns.barplot(y=mat_c["index"][:15],palette="plasma",linewidth=1,edgecolor="k"*15)
plt.xlabel("number of matches")
plt.ylabel("City")
plt.grid(True)
plt.title("Cities with maximum world cup matches",color='b')
for i,j in enumerate("Matches :"+mat_c["City"][:15].astype(str)):
  ax.text(0.7,i,j,fontsize=13,color="w")
plt.show()
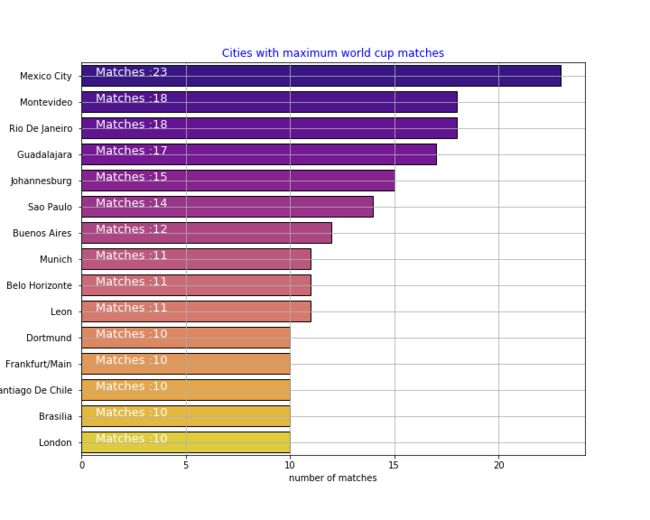
小疑问:这段代码的循环部分看的还不是太明白;另排名前15的城市只认识一个伦敦
更新 20180724
赢得过世界杯冠军的8支球队 Beazil5 Germany4 Italy4 Argentina2 Uruguay2 England1 France1 Spain1
import os
import pandas as pd
import seaborn as sns
import matplotlib.pyplot as plt
os.chdir("Python_practice/kaggle_practice")
cups = pd.read_csv(r"Worldcups.csv")
cups["Winner"]=cups["Winner"].replace("Germany FR","Germany")
cups["Runners-Up"]=cups["Runners-Up"].replace("Germany FR","Germany")
c2 = cups.groupby("Winner")['Year'].count().reset_index()
c12 = c2.sort_values(by="Year",ascending=False)
plt.figure(figsize=(10,8))
ax = sns.barplot("Year","Winner",data=c12)
plt.xlabel("count")
plt.title("Teams with the most world cup final victories")
plt.show()