编译:李琼琼 (山东大学)
Email: [email protected]
Source: Cattaneo, Matias, D, et al. Inference in regression discontinuity designs under local randomization[J]. The stata journal, 2016.
Stata连享会 计量专题 || 精品课程 || 推文 || 公众号合集
2020寒假Stata现场班
北京, 1月8-17日,连玉君-江艇主讲
2020连享会-文本分析与爬虫-现场班
西安, 3月26-29日,司继春-游万海 主讲 (附助教招聘)
1.背景
断点回归被认为是局部的随机实验,因此随机推断的方法也可以适用于断点回归,但原则上需要使用断点 (cutoff) 附近的观测值。另一方面,经典的断点回归需要较大的样本量,因为无论是参数估计还是非参数估计,均要求分配变量的密度在断点处是连续的,并且做非参数估计时,使用局部多项式做非参数统计推断,也依靠了大样本渐进理论。这就导致了如果带宽过小或者数据集本身就不大,平滑性检验通不过或者估计效果会变得不好的问题。
为了解决样本量有限的问题,美国普林斯顿大学的 Cattano 教授及其合作者于 2016 年开发了一套 rdlocrand Stata 命令包,运用了随机实验的方法来解决有效样本量 (带宽内的样本数量) 过少的问题。
rdlocrand package 包含了四个命令,本文结合 Cattaneo et al. (2015,[PDF]) 关于美国 1994-2010 年参议院选举的样本数据对这四个命令及其功能进行介绍。
准备 :安装需要使用的命令包
ssc install st0435.pkg,from (http://www.stata-journal.com/software/sj16-2/)
2. 有限样本的断点回归
2.1 RDD 适用性检验和最优带宽的选择
Note: Cattaneo et al. (2015) 使用的参议院选举数据和 David S. Lee (2007,[PDF])使用选举数据在样本的时间段和变量选择上有区别,另外对"在位优势"的定义也不同,David S. Lee 认为 t 期胜出选票的份额对 t+1 期的选举结果有正向影响说明存在"在位优势",而 Cattaneo et al. 则把 "在位优势" 定义为 t 期对 t+2 期的影响。
rdwinselect 命令有两个作用,(1) 利用前定变量(除配置变量以外的其他解释变量) 做 RDD 适用性检验; (2) 在适用性条件被满足的前提下,挑选最优带宽,适用于有限样本和大样本。基本的语法格式如下:
rdwinselect runvar [covariates] [if] [in], [, options]
其中,主要选项为:
-
runvar: 分配变量 -
covariates: 协变量 -
cutoff(): 分配变量临界值, 默认为 c(0) -
obsmin(): 设定左、右带宽包括最少的观测值的个数 -
wmin(): 设定模型带宽长度的最小临界值 -
wstep: 设定模型每次带宽增加的长度 -
nwindows: 设定带宽的个数 -
approximate: 使用大样本渐进理论,默认基于随机推断 -
p(): 结果变量修正模型的阶数,默认 p(0) -
plot: 画出协变量检验的最小 p 值图 -
reps(): 随机试验重复的次数,默认 reps(1000)
命令的使用
.sysuse rdlocrand_senate, clear //调用数据
.global covariates presdemvoteshlag1 population demvoteshlag1 demvoteshlag2 ///
.demwinprv1 demwinprv2 dopen dmidterm     //把分配变量以外的所有解释变量设为全局变量 covariates
.rdwinselect demmv $covariates, cutoff(0) //为RD回归选择带宽, demmv是分配变量,代表民主党超过最大对手党派的投票份额(单位:%)

*----------使用 rdwinselect 命令 table1 ----------------------
Window selection for RD under local randomization


Cutoff c = 0.00   | Left of c   Right of c        Number of obs  =          1390
------------------+-----------------------        Order of poly  =             0
    Number of obs |       640          750        Kernel type    =       uniform
   1st percentile |         6            7        Reps           =          1000
   5th percentile |        32           37        Testing method =     rdrandinf
  10th percentile |        64           75        Balance test   =         ttest
  20th percentile |       128          150


                  |   Bal. test         Var. name    Bin. test
 Window length /2 |    p-value        (min p-value)   p-value     Obs=c
------------------+-------------------------------------------------------------
            0.529 |      0.210       demvoteshlag2      0.327        10       16
            0.733 |      0.262            dopen         0.200        15       24
            0.937 |      0.132            dopen         0.126        16       27
            1.141 |      0.044            dopen         0.161        20       31
            1.346 |      0.229         dmidterm         0.382        28       36
            1.550 |      0.102         dmidterm         0.728        35       39
            1.754 |      0.075         dmidterm         0.747        41       45
            1.958 |      0.046         dmidterm         0.602        43       49
            2.163 |      0.075         dmidterm         0.480        45       53
            2.367 |      0.132            dopen         0.637        53       59

Variable used in binomial test (running variable): demmv
Covariates used in balance test: presdemvoteshlag1 population demvoteshlag1 demv
> oteshlag2 demwinprv1 demwinprv2 dopen dmidterm

Recommended window is [-.733; .733] with 39 observations (15 below, 24 above).
解读:rdwinselect 命令推荐的最优窗口是 [-.733; .733], 带宽为 0.733 - (-0.733) = 1.467,断点左右两边观测值个数分别为 15 和 24.
*----------使用 rdwinselect 命令 figure1 ----------------------
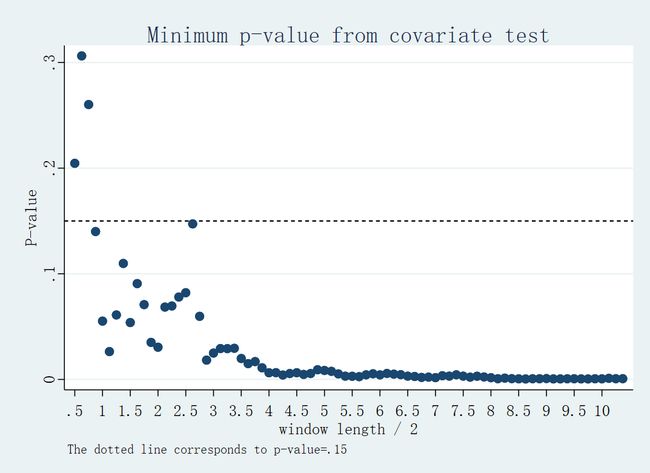
.quietly rdwinselect demmv $covariates, wmin(.5) wstep(.125) ///
nwin(80) approximate plot    //quietly 表示安静地执行命令不显示结果,只出现图
解读:协变量检验从带宽窗口 [0.5; 0.5] 开始以 0.125 的长度依次增长,可以看出第三个带宽窗口 [0.75, 0.75] 的最小 p 值超过了0.15 线,是符合协变量检验的最优带宽, 这和前面推荐的带宽窗口 [-.733; .733] 非常接近。
连享会计量方法专题……,https://gitee.com/arlionn/Course
2.2 断点回归估计
rdrandinf 命令运用随机推断,对断点回归进行估计,基本的语法格式如下:
rdrandinf outvar runvar [if] [in], [, options]
其中,主要选项为:
-
runvar: 分配变量 -
covariates: 协变量 -
cutoff(): 断点,分配变量临界值, 默认为 c(0) -
wl(): 设定带宽窗口的左边界 -
wr(): 设定带宽窗口的右边界 -
covariates: 协变量 -
kernel: 选择核函数, uniform (均匀核,默认), triangular (三角核), epanechnikov(二次核) -
fuzzy(): 设定模糊断点回归中的内生处理变量
命令的使用
*----------使用 rdrandinf 命令 table2 ----------------------
.rdrandinf demvoteshfor2 demmv, wl(-.75) wr(.75) //处理效应估计,设定带宽为 [0.75; 0.75]
//变量 demvoteshfor2 为结果变量,即 t+2 期的民主党获得投票份额

Selected window = [-.75 ; .75]
Running randomization-based test...

Cutoff c = 0.00   |  Left of c  Right of c        Number of obs =           1390
------------------+-----------------------        Order of poly =              0
     Number of obs|        595         702        Kernel type   =        uniform
Eff. Number of obs|         15          22        Reps          =           1000
   Mean of outcome|     42.808      52.497        Window        =    set by user
   S.D. of outcome|      7.042       7.742        H0:       tau =          0.000
            Window|     -0.750       0.750        Randomization =  fixed margins

Outcome: demvoteshfor2. Running variable: demmv.
--------------------------------------------------------------------------------
                  |              Finite sample             Large sample
                  |             ---------------  -------------------------------
         Statistic|      T           P>|T|         P>|T|   Power vs d =     3.52
------------------+-------------------------------------------------------------
    Diff. in means|      9.689       0.000          0.000                  0.300
--------------------------------------------------------------------------------
解读:处理效应为 9.689, 表明民主党于 t 期控制参议院导致了民主党于 t+2 期获得投票份额在断点提高了约 10%, 在 1% 的显著性水平下显著。 Finite sample 下面的 p 值是基于随机检验的结果,而 large sample 下面的 p 值则基于渐进分布理论。
2.3 敏感性分析 (一)
rdsensitivity 命令分析了对于不同的带宽, 处理效应估计值对应的 p 值和置信区间的敏感性,基本语法如下:
rdsensitivity outvar runvar [if] [in], [, options]
其中,主要选项为:
-
outvar: 结果变量 -
runvar: 分配变量 -
covariates: 协变量 -
cutoff(): 断点,分配变量临界值, 默认为 c(0) -
wlist: 设定被估计带宽长度的范围 -
tlist(): 处理效应估计值的范围(整数) -
saving(filename): 保存敏感性分析的等高线图 -
nodots: 删除重复的点 -
nodraw: 删除等高线 -
verbose: 输出 p 值的矩阵结果 -
reps: 随机试验重复的次数,默认 reps(1000)
命令的使用
*----------使用 rdsensitivity 命令 table3 ----------------------
.rdsensitivity demvoteshfor2 demmv, wlist(.75(.25)2) tlist(0(1)20) nodots verbose
//此命令运行时间较长,要耐心等待
Running randomization-based test...

Randomization-based test complete.

             |       .75          1       1.25        1.5       1.75          2
-------------+------------------------------------------------------------------
           0 |         0       .001          0          0          0          0
           1 |         0       .001          0          0          0          0
           2 |      .001       .001       .002          0          0          0
           3 |      .013       .004       .003          0          0          0
           4 |       .03       .009       .007       .002       .001          0
           5 |      .068       .023       .018       .013       .003       .005
           6 |      .147       .062       .042       .037       .039       .029
           7 |      .309       .144       .093       .088       .106       .092
           8 |      .518       .306       .173       .239       .233       .262
           9 |      .788       .534       .299       .427       .484       .569
          10 |      .918       .869       .497       .731        .83       .939
          11 |      .608       .844       .756       .907       .839       .668
          12 |      .378       .514       .969       .574       .496        .36
          13 |      .201       .268       .665       .323       .231       .134
          14 |      .102       .139       .428       .154        .09       .036
          15 |       .04       .051       .254       .064       .035       .007
          16 |      .019       .016        .13       .022       .009       .002
          17 |      .008       .006       .073       .004       .003          0
          18 |      .003          0       .032       .001          0          0
          19 |      .001          0        .01       .001          0          0
          20 |         0          0       .002          0          0          0
解读: 列名称(.75 等)表示窗宽; 行名称 (0 等) 表示处理效应值,也是估计的原假设; 矩阵的值代表 p 值。当带宽为 [-.75; 0.75] 时,在 95% 的显著性水平下,处理效应估计值为 5 - 14 不会被拒绝,故认为带宽为 [-.75; 0.75] 对应的处理效应值在 5 到 14 之间。同样地,带宽为 [2; 2] 时,处理效应值为 7 到 13 之间。
*----------使用 rdsensitivity 命令 figure2 ----------------------
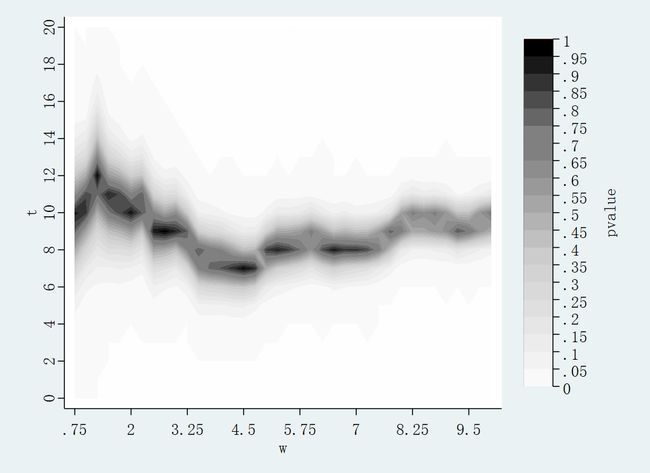
. rdsensitivity demvoteshfor2 demmv, wlist(.75(.25)10) tlist(0(1)20) nodots ///
saving(figure2)  //saving()可以允许后面对等高线图进行颜色外观等的修改
. use figure2, clear
. twoway contour pvalue t w, ccuts(0(0.05)1) ccolors(gray*0.01 gray*0.05 ///
 gray*0.1 gray*0.15 gray*0.2 gray*0.25 gray*0.3 gray*0.35  ///
 gray*0.4 gray*0.5 gray*0.6 gray*0.7 gray*0.8 gray*0.9 gray ///
 black*0.5 black*0.6 black*0.7 black*0.8 black*0.9 black)  ///
 xlabel(.75(1.25)10) ylabel(0(2)20, nogrid) graphregion(fcolor(none))
解读: 由图像也可以看出带宽为 [-.75; 0.75]时,p 值超过 5% 对应的处理效应值在 5 到 14 之间。
2.4 敏感性分析 (二)
rdrbounds 命令是基于 Rosenbaum (2002) 的局部随机化理论,计算不同偏离程度下 p 值变化的范围。
rdrbounds demvoteshfor2 demmv, expgamma(1.5 2 3) wlist(.5 .75 1) reps(1000)
rdrbounds outvar runvar [if] [in], [, options]
其中,主要选项为:
-
runvar: 分配变量 -
cutoff(): 断点,分配变量临界值, 默认为 c(0) -
expgamma(): 需要被估计的 exp(gamma) 的值, 默认为expgamma(1.5 2 2.5 3) -
reps: 随机试验重复的次数,默认reps(500)
命令的使用
*----------使用  rdrbounds 命令 table4 ----------------------
 .rdrbounds demvoteshfor2 demmv, expgamma(1.5 2 3) wlist(.5 .75 1) reps(1000)
 //此命令运行时间也比较长

 Calculating randomization p-values...
                            w =     0.500      0.750      1.000
 --------------------------------------------------------------
             Bernoulli p-value|     0.005      0.000      0.000
 --------------------------------------------------------------

 Running sensitivity analysis...
 gamma  exp(gamma)          w =     0.500      0.750      1.000
 --------------------------------------------------------------
  0.41     1.50    lower bound|     0.004      0.000      0.000
                   upper bound|     0.024      0.005      0.002
 -----------------------------+--------------------------------
  0.69     2.00    lower bound|     0.005      0.000      0.000
                   upper bound|     0.052      0.025      0.008
 -----------------------------+--------------------------------
  1.10     3.00    lower bound|     0.005      0.000      0.000
                   upper bound|     0.194      0.145      0.058
 --------------------------------------------------------------
解读: rdrbounds 命令的结果分为两部分,第一个是每个带宽对应 Bernoulli trials 的 p 值, 第二个是在不同的 Γ 和 窗宽下,p 值大小临界值的距离,如果 p 值大小临界值的距离越大,说明随机试验偏差推断越敏感。
第二个结果有两种分析方式,(1) 固定窗宽,看随机试验不同的偏离度如何影响 p 值;(2) 固定随机试验的偏离度,看不同的窗宽如何影响 p 值。对于模型推荐的带宽 [-0.75; 0.75], 在各种偏度下结果都较为稳健。
结语
本文主要对 rdlocrand package 的四个命令 rdwinselect rdrandinf rdsensitivity rdrbounds 进行介绍,并通过美国参议院选举的数据来应用这些命令做 RDD 适用性检验和最优带宽的选择、有限样本的RDD 估计, 以及处理效应值和窗宽敏感性分析。
参考文献
[1] Cattaneo M D , Frandsen B R , Titiunik, Rocío. Randomization Inference in the Regression Discontinuity Design: An Application to Party Advantages in the U.S. Senate[J]. Journal of Causal Inference, 2015, 3(1):1-24pdf.
[2] Cattaneo, Matias, D, et al. Inference in regression discontinuity designs under local randomization[J]. The stata journal, 2016pdf.
[3] Lee D S. Randomized experiments from non-random selection in US House elections[J]. Journal of Econometrics, 2008, 142(2): 675-697pdf.
连享会计量方法专题……,https://gitee.com/arlionn/Course
Appendix 本文涉及的 Stata 代码
sysuse rdlocrand_senate, clear  //调用数据
global covariates presdemvoteshlag1 population demvoteshlag1 demvoteshlag2 ///
demwinprv1 demwinprv2 dopen dmidterm     //把分配变量以外的所有解释变量设为全局变量 covariates
*----------使用 rdwinselect 命令 table1 ----------------------
rdwinselect demmv $covariates, cutoff(0) //为RD回归选择带宽, demmv是分配变量,代表民主党超过最大对手党派的投票份额(单位:%)
*----------使用 rdwinselect 命令 figure1 ----------------------
quietly rdwinselect demmv $covariates, wmin(.5) wstep(.125) ///
nwin(80) approximate plot    //quietly 表示安静地执行命令不显示结果,只出现图
*----------使用 rdrandinf 命令 table2 ----------------------
rdrandinf demvoteshfor2 demmv, wl(-.75) wr(.75) //处理效应估计,设定带宽为 [0.75; 0.75]
//变量 demvoteshfor2 为结果变量,即 t+2 期的民主党获得投票份额
*----------使用 rdsensitivity 命令 table3 ----------------------
rdsensitivity demvoteshfor2 demmv, wlist(.75(.25)2) tlist(0(1)20) nodots verbose //命令运行时间较长
*----------使用 rdsensitivity 命令 figure2 ----------------------
rdsensitivity demvoteshfor2 demmv, wlist(.75(.25)10) tlist(0(1)20) nodots ///
saving(figure2)  //saving()可以允许后面对等高线图进行颜色外观等的修改
use figure2, clear
twoway contour pvalue t w, ccuts(0(0.05)1) ccolors(gray*0.01 gray*0.05 ///
 gray*0.1 gray*0.15 gray*0.2 gray*0.25 gray*0.3 gray*0.35  ///
 gray*0.4 gray*0.5 gray*0.6 gray*0.7 gray*0.8 gray*0.9 gray ///
 black*0.5 black*0.6 black*0.7 black*0.8 black*0.9 black)  ///
 xlabel(.75(1.25)10) ylabel(0(2)20, nogrid) graphregion(fcolor(none))
*----------使用  rdrbounds 命令 table4 ----------------------
rdrbounds demvoteshfor2 demmv, expgamma(1.5 2 3) wlist(.5 .75 1) reps(1000)
  //此命令运行时间比较长
连享会直播:我的特斯拉—实证研究设计(连玉君主讲)
课程主页:https://gitee.com/arlionn/Live
关于我们
- Stata连享会 由中山大学连玉君老师团队创办,定期分享实证分析经验。
- 欢迎赐稿: 欢迎赐稿至[email protected]。录用稿件达 三篇 以上,即可 免费 获得一期 Stata 现场培训资格。
- 往期精彩推文:
Stata绘图 | 时间序列+面板数据 | Stata资源 | 数据处理+程序 | 回归分析-交乘项-内生性


