本文由 沈庆阳 所有,转载请与作者取得联系!
内容
TensorFlow基本概念
使用线性回归预测房价
使用均方根误差评估预测准确率
调整超参数提高模型准确率
1990年加州房屋训练数据集:
https://raw.githubusercontent.com/sqy941013/learnmachinelearning/master/california_housing_train.csv
准备(Setup)
首先,在进行之前,我们需要导入需要的Python包。
import math

from IPython import display
from matplotlib import cm
from matplotlib import gridspec
from matplotlib import pyplot as plt
import numpy as np
import pandas as pd
from sklearn import metrics
import tensorflow as tf
from tensorflow.python.data import Dataset
然后对Pandas和TensorFlow进行相关的设置,设置的内容从代码就可以看明白。
tf.logging.set_verbosity(tf.logging.ERROR)
pd.options.display.max_rows = 10
pd.options.display.float_format = '{:.1f}'.format
然后便是加载数据集,在第8讲我们讲解了如何使用Pandas将csv数据加载到DataFrame对象,因此此处不再赘述。
california_housing_dataframe = pd.read_csv("https://raw.githubusercontent.com/sqy941013/learnmachinelearning/master/california_housing_train.csv", sep=",")
然后便是使用Numpy的随机方法对数据进行随机化处理。
california_housing_dataframe = california_housing_dataframe.reindex(
    np.random.permutation(california_housing_dataframe.index))
california_housing_dataframe["median_house_value"] /= 1000.0
california_housing_dataframe
在准备完毕之后,我们可以通过Pandas的describe()函数来对数据进行预览。其输出一些统计信息,如:样本数、均值、标准偏差、最大值、最小值和各种分位数。
搭建第一个机器学习模型
在该教程中,选取房价中值作为预测的目标,median_house_value即标签。
我们选取TensorFlow Estimator API的LinearRegressor接口(线性回归)。
LinearRegressor的官方API页面:
https://www.tensorflow.org/api_docs/python/tf/estimator/LinearRegressor?hl=zh-cn
TensorFlow的Estimator API负责大量的低级别模型搭建工作,且提供执行模型训练、评估和推理的便于使用的方法。
1:定义特征并配置特征列
我们从csv中导入的数据是原始数据,上一节中讲过,我们需要用特征工程的一些方法将原始数据转换成特征矢量。这一节,我们主要会处理分类数据和数值数据。其中,分类数据即一种文字数据。
在TensorFlow里,我们使用“特征列”来表示特征的数据类型。特征列存储数据的描述,不包含特征数据本身。
在这里,我们选取通过total_rooms数值作为输入特征。
# 定义输入特征: total_rooms
my_feature = california_housing_dataframe[["total_rooms"]]

# 配置数值特征
feature_columns = [tf.feature_column.numeric_column("total_rooms")]
上述代码通过在california_housing_dataframe 中提取出total_rooms的数据,并且使用numeric_column定义特征列,将其数据指定为数值。
2:定义目标(标签)
由于我们需要预测的是median_house_value,因此我们将median_house_value同样从california_housing_dataframe中提取出来。
# 定义标签
targets = california_housing_dataframe["median_house_value"]
3:配置LinearRegressor
LinearRegressor即线性回归模型,我们使用GradientDescentOptimizer训练这个模型。通过learning_rate这个超参数来控制梯度步长大小。
# 使用GradientDescentOptimizer训练这个模型
my_optimizer=tf.train.GradientDescentOptimizer(learning_rate=0.0000001)
my_optimizer = tf.contrib.estimator.clip_gradients_by_norm(my_optimizer, 5.0)

# 配置线性回归模型
linear_regressor = tf.estimator.LinearRegressor(
    feature_columns=feature_columns,
    optimizer=my_optimizer
)
4:定义输入函数
在继续进行下去之前,我们需要将数据导入到LinearRegressor中。要做到导入数据则需要一个数据输入函数,该函数会告诉TensorFlow如何对我们的数据进行预处理、在训练模型的时候如何进行批处理(Batching)和随机处理、
首先需要将Pandas特征数据转换为Numpy的Dictionary。然后运用TensorFlow Dataset API来构建Dataset对象,并根据batch_size大小来拆分数据为多个批次,并按照指定周期数(num_epochs)重复。
TensorFlow Dataset API的官方文档页面:
https://www.tensorflow.org/programmers_guide/datasets
最后,输入函数为该数据集构建了一个迭代器,并向LinearRegressor返回下一批数据。
def my_input_fn(features, targets, batch_size=1, shuffle=True, num_epochs=None):
    """训练一个单特征的线性回归模型

    参数:
      features: 特征的Pandas DataFrame对象
      targets: 目标的Pandas DataFrame对象
      batch_size: 传给模型的批次大小
      shuffle: 是否对数据进行随机处理
      num_epochs: 指定周期数,若设置为None则无限循环
    返回:
      下一批数据的特征和标签组成的元组
    """

    # 将Pandas数据转换为Numpy字典
    features = {key:np.array(value) for key,value in dict(features).items()}

    # 创建数据集、配置批次和重复
    ds = Dataset.from_tensor_slices((features,targets)) # warning: 2GB limit
    ds = ds.batch(batch_size).repeat(num_epochs)

    # Shuffle the data, if specified
    if shuffle:
      ds = ds.shuffle(buffer_size=10000)

    # 返回下一批数据
    features, labels = ds.make_one_shot_iterator().get_next()
    return features, labels
5:训练模型
在一切准备完成之后,我们可以调用LinearRegressor的train()方法来训练模型。
_ = linear_regressor.train(
    input_fn = lambda:my_input_fn(my_feature, targets),
    steps=100
)
对TensorFlow输入函数的进一步学习,参考TensorFlow官方文档:
https://www.tensorflow.org/get_started/input_fn#passing_input_fn_data_to_your_model
6:评估模型
没有对模型进行评估,我们永远不知道我们训练的模型是否达到了要求,是否可以结束训练。
所以,我们需要基于训练数据做一次预测,来看模型对这些数据的拟合情况怎么样。
# 创建一个预测的输入函数
prediction_input_fn =lambda: my_input_fn(my_feature, targets, num_epochs=1, shuffle=False)

# 调用LinearRegressor的predict()方法
predictions = linear_regressor.predict(input_fn=prediction_input_fn)

# 将预测转为Numpy数组
predictions = np.array([item['predictions'][0] for item in predictions])

# 输出均方误差和均方根误差
mean_squared_error = metrics.mean_squared_error(predictions, targets)
root_mean_squared_error = math.sqrt(mean_squared_error)
print "Mean Squared Error (on training data): %0.3f" % mean_squared_error
print "Root Mean Squared Error (on training data): %0.3f" % root_mean_squared_error
在运行上述代码之后,我们可以看到的输出如下:
Mean Squared Error (on training data): 56367.025
Root Mean Squared Error (on training data): 237.417
很明显,均方误差很难理解,而均方根误差则很好解读。
通过均方根误差(RMSE)我们可以判断这个模型的效果如何。均方根误差应该怎样解读呢?首先我们比较一下均方根误差与预测目标的最大值和最小值。
最大值:500.001 最小值:14.999 最大值与最小值差:485.002 均方根误差:237.417
我们可以看到,均方根误差是最大值和最小值差值的一半左右。这个误差是整个目标值范围的一般,那么是否可以采取进一步措施来缩小误差呢?
首先,我们需要了解目标和预测的总体照耀统计信息,查看预测和目标是否相符合。
calibration_data = pd.DataFrame()
calibration_data["predictions"] = pd.Series(predictions)
calibration_data["targets"] = pd.Series(targets)
calibration_data.describe()
输出:
     predictions    targets
count 17000.0 17000.0
mean   0.1  207.3
std    0.1  116.0
min    0.0  15.0
25%    0.1  119.4
50%    0.1  180.4
75%    0.2  265.0
max    1.9  500.0
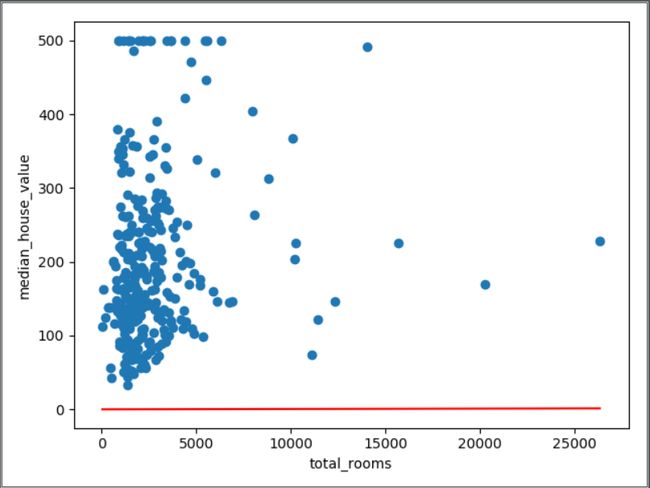
在通过比较这些统计信息之外,我们还可以画出样本作为数据点和学习的曲线(在线性回归是直线,直线也是曲线的一种),即对这个训练的过程可视化。在其前面讲过,单一特征的线性回归是将输入x映射到输出y的一条直线。
# 获得均匀分布的随机数据样本,用于绘制散点
sample = california_housing_dataframe.sample(n=300)

# 获得最大和最小特征值
x_0 = sample["total_rooms"].min()
x_1 = sample["total_rooms"].max()

# 获取训练得到的偏差和权重(几何上直线的截距和斜率)
weight = linear_regressor.get_variable_value('linear/linear_model/total_rooms/weights')[0]
bias = linear_regressor.get_variable_value('linear/linear_model/bias_weights')

# 获得预测的房屋价格中值对应最大和最小total_rooms的值
y_0 = weight * x_0 + bias
y_1 = weight * x_1 + bias

# 绘制(x_0, y_0) 到 (x_1, y_1)的回归直线
plt.plot([x_0, x_1], [y_0, y_1], c='r')

# 标注x y轴
plt.ylabel("median_house_value")
plt.xlabel("total_rooms")

# 绘制散点
plt.scatter(sample["total_rooms"], sample["median_house_value"])

# 显示图
plt.show()
在观察上幅图,我们可以发现回归曲线跟我们的样本散点相差太多了。那么我们应该怎样让我们的模型更贴近样本,得到较好的预测呢?
调整模型超参数
通过对上述代码的整理,将所有的代码放入了一个名为train_model的函数中。
def train_model(learning_rate, steps, batch_size, input_feature="total_rooms"):
  """训练一个单特征的线性回归模型

  参数:
    learning_rate: 浮点型,定义学习的速率
    steps: 非零整型,训练的总步数
    batch_size:非零整型,批次大小
    input_feature: 字符串,california_housing_dataframe中作为输入特征的的一列
  """

  periods = 10
  steps_per_period = steps / periods

  my_feature = input_feature
  my_feature_data = california_housing_dataframe[[my_feature]]
  my_label = "median_house_value"
  targets = california_housing_dataframe[my_label]

  # 创建特征列
  feature_columns = [tf.feature_column.numeric_column(my_feature)]

  # 创建输入函数
  training_input_fn = lambda:my_input_fn(my_feature_data, targets, batch_size=batch_size)
  prediction_input_fn = lambda: my_input_fn(my_feature_data, targets, num_epochs=1, shuffle=False)

  # 创建线性回归对象
  my_optimizer = tf.train.GradientDescentOptimizer(learning_rate=learning_rate)
  my_optimizer = tf.contrib.estimator.clip_gradients_by_norm(my_optimizer, 5.0)
  linear_regressor = tf.estimator.LinearRegressor(
      feature_columns=feature_columns,
      optimizer=my_optimizer
  )

  # 设置模型的绘图参数
  plt.figure(figsize=(15, 6))
  plt.subplot(1, 2, 1)
  plt.title("Learned Line by Period")
  plt.ylabel(my_label)
  plt.xlabel(my_feature)
  sample = california_housing_dataframe.sample(n=300)
  plt.scatter(sample[my_feature], sample[my_label])
  colors = [cm.coolwarm(x) for x in np.linspace(-1, 1, periods)]

  #训练模型
  print "Training model..."
  print "RMSE (on training data):"
  root_mean_squared_errors = []
  for period in range (0, periods):
    linear_regressor.train(
        input_fn=training_input_fn,
        steps=steps_per_period
    )
    # 计算预测
    predictions = linear_regressor.predict(input_fn=prediction_input_fn)
    predictions = np.array([item['predictions'][0] for item in predictions])

    # 计算损失
    root_mean_squared_error = math.sqrt(
        metrics.mean_squared_error(predictions, targets))
    # 输出损失值
    print "  period %02d : %0.2f" % (period, root_mean_squared_error)
    root_mean_squared_errors.append(root_mean_squared_error)
    # 跟踪权重和偏差
    y_extents = np.array([0, sample[my_label].max()])

    weight = linear_regressor.get_variable_value('linear/linear_model/%s/weights' % input_feature)[0]
    bias = linear_regressor.get_variable_value('linear/linear_model/bias_weights')

    x_extents = (y_extents - bias) / weight
    x_extents = np.maximum(np.minimum(x_extents,
                                      sample[my_feature].max()),
                           sample[my_feature].min())
    y_extents = weight * x_extents + bias
    plt.plot(x_extents, y_extents, color=colors[period])
  print "Model training finished."

  # 绘制损失图
  plt.subplot(1, 2, 2)
  plt.ylabel('RMSE')
  plt.xlabel('Periods')
  plt.title("Root Mean Squared Error vs. Periods")
  plt.tight_layout()
  plt.plot(root_mean_squared_errors)

  # 输出矫正数据表
  calibration_data = pd.DataFrame()
  calibration_data["predictions"] = pd.Series(predictions)
  calibration_data["targets"] = pd.Series(targets)
  display.display(calibration_data.describe())

  print "Final RMSE (on training data): %0.2f" % root_mean_squared_error
我们通过如下函数调用train_model方法
train_model(
    learning_rate=0.00002,
    steps=500,
    batch_size=5
)
运行完毕之后,控制台输出如下:
Training model...
RMSE (on training data):
2018-05-02 20:29:35.503528: I C:\tf_jenkins\workspace\tf-nightly-windows\M\windows\PY\36\tensorflow\core\platform\cpu_feature_guard.cc:140] Your CPU supports instructions that this TensorFlow binary was not compiled to use: AVX2
  period 00 : 225.63
  period 01 : 214.42
  period 02 : 204.44
  period 03 : 194.97
  period 04 : 187.55
  period 05 : 181.34
  period 06 : 175.44
  period 07 : 171.40
  period 08 : 168.84
  period 09 : 167.02
Model training finished.
       predictions  targets
count      17000.0  17000.0
mean         119.0    207.3
std           98.1    116.0
min            0.1     15.0
25%           65.8    119.4
50%           95.7    180.4
75%          141.8    265.0
max         1707.2    500.0
Final RMSE (on training data): 167.02

Process finished with exit code 0
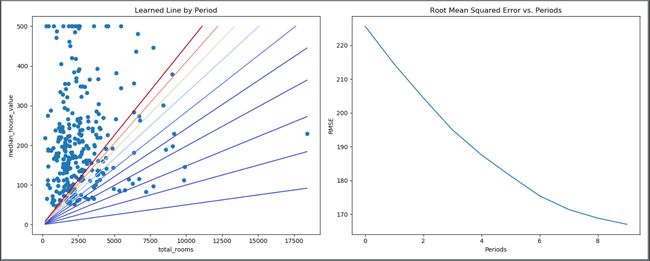
并得到我们绘制的两张图
我们可以明显地看出,我们的模型不断地寻找误差最小的线性回归模型。右侧的RMSE也在不断减小。
通过不断调整我们的超参数,会得到损失函数的最低点,训练出效果最好的模型。
后记
至此,我们的第一个TensorFlow搭建的简单线性回归模型项目搭建完毕。这个练习是对前面的一些课程的综合,也是名副其实的第一个TensorFlow的项目。虽然简单,但是它拥有机器学习项目的标准流程,也是真正地打开了机器学习的大门。
项目完整代码:
https://www.jianshu.com/p/71476594732b
觉得写的不错的朋友可以点一个 喜欢♥ ~
谢谢你的支持!

