
Pandas基础概念
- 数据结构
Pandas中的数据结构有四种,分别是Series、time series、dataframe、panel:
| 数据结构 | 简介 |
|---|---|
| Series | 这是一位数组,只有一行或一列,与array一样只储存同一类型的数据,而list中可以存在不同类型的元素。 |
| time series | 时间序列,每个数据以时间为索引。 |
| dataframe | 二维表格型数据结构,是序列的容器,与excel通用 |
| Panel | 三维数组,是dataframe的容器 |
1.1 创建一个series
创建series的方法与创建numpy的ndarray对象类似:
In [1]:
import numpy as np
import pandas as pd
a=pd.Series([1,2,3,4])
a
Out[1]:
0    1
1    2
2    3
3    4
dtype: int64
注意,series自带索引,查看元素的方式与array一样,指定想要抽取的索引即可:
In [2]:a[3]
Out[2]:4
可将series的内容以图形表示:
%matplotlib inline
a.plot(kind='bar',figsize=[5,4])
#不定义bar,则默认为折线图
#figsize是定义图形的大小,(宽,高)

创建序列后,我们能够迅速得到该序列的描述性统计量:
In [3]:
import numpy as np
import pandas as pd
a=pd.Series([1,2,3,4])
a.describe()
Out[3]:
count 4.000000
mean 2.500000
std 1.290994
min 1.000000
25% 1.750000
50% 2.500000
75% 3.250000
max 4.000000
dtype: float64
然后将其保存到文件:a.to_csv('a.csv'),运行后电脑里就会多了一个a.csv文件,用excel打开:

或者放进一个字典里:a.to_dict(), 于是,索引就变成了key,序列元素就变成了对应了value。
如果想删掉序列中某一个元素,则可以用nan()函数。比如在Series([1,2,3,4])中,想把2去掉,则可输入a[1]=np.nan。运行后,序列将变成[1、Nan、3、4]。索引1的位置变成空值了。
若序列中含有Nan空值,在求描述性统计量的时候,程序将忽略空值的位置,只对其余三个数求统计量。
1.2 创建一个DataFrame
我们可以用序列或字典来创建DataFrame:
#序列转DataFrame
In [4]:
import numpy as np
import pandas as pd
a={'aa':pd.Series([1,2,3,4],index=['w','x','y','z']),'bb':pd.Series([1,2,3],index=['w','x','y'])}
df=pd.DataFrame(a)
df
Out[4]:
    aa  bb
w   1   1
x   2   2
y   3   3
z   4   NaN
#字典转DataFrame
In [5]:
import numpy as np
import pandas as pd
a=[{'aa':'who','bb':'are','cc':'you'},{'aa':'who','bb':'am','cc':'I'},{'aa':'what','bb':'are','cc':'you','dd':'doing'}]
df=pd.DataFrame(a,index=['x','y','z'],columns=['aa','bb','cc','dd'])
df.index.name='index'
df
Out[5]:
       aa   bb  cc  dd
index
x     who   are you NaN
y     who   am  I   NaN
z     what  are you doing
假如要指定某一列的内容为索引,可用set_index('key')函数,比如:
In [6]:
import numpy as np
import pandas as pd
a=[{'aa':'who','bb':'are','cc':'you'},{'aa':'who','bb':'am','cc':'I'},{'aa':'what','bb':'are','cc':'you','dd':'doing'}]
df=pd.DataFrame(a)
print df
df.set_index('aa')
#若用set_index[(''),('')],可用列表的形式添加双索引

     aa   bb   cc     dd
0   who  are  you    NaN
1   who   am    I    NaN
2  what  are  you  doing
Out[6]:
         bb cc  dd
aa
who     are you NaN
who     am  I   NaN
what    are you doing
- 读写数据文件
要将数据存储到电脑的文件里,可用to_excel()或to_csv(),要读取时则可用read_excel()或read_csv()。若文档不在py的文件夹里,则可输入绝对路径进行存储。要指定页名称,可用to_excel('xxx.xlsx',sheet_name='xxx')。
上述函数中,如果文件里有中文,最好在函数中加上,encoding='GBK',以防有乱码出现。
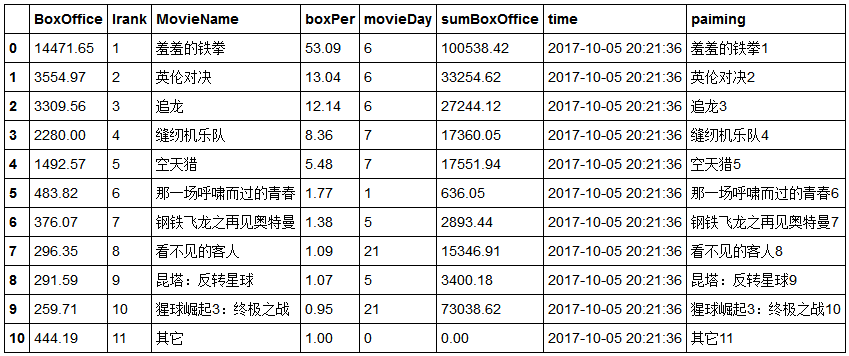
以电影票房数据为例,先从tushare上导入实时票房数据:
import tushare as ts
df = ts.realtime_boxoffice()
df

若要看前两行,则输入df.head(2),括号内留空则默认列出前五行;要看后两行则输入df.tail(2),十分方便。
若要选取某一列数据,可输入df.sumBoxOffice或df['sumBoxOffice'],可得:
In [7]:
import tushare as ts
import numpy as np
from __future__ import division
df = ts.realtime_boxoffice()
a=df.Irank
b=df.MovieName
df[u'paiming']=b+a
df
- 数据的切片与筛选
假如我们要在一堆数据中截取某一部分数据,可有多种办法实现。例如要选取前两行:
In [8]:
import tushare as ts
import numpy as np
df = ts.realtime_boxoffice()
df[0:2]

假如我们要选某行某列的数据,例如索引为3、4、5的总票房数据sumBoxOffice, 则可用loc()函数,location的意思,输入:
In [9]:
import tushare as ts
import numpy as np
df = ts.realtime_boxoffice()
print df.set_index('Irank')
print '*'*30
print df.loc[2,'sumBoxOffice'] #指定具体的行
print '*'*30
df.loc[[3,4,5],['sumBoxOffice','boxPer']]
#用字典的形式指定具体要提取的多行多列
#若用标签来指定具体行,则不受包前不包后规则的限制。
#
      BoxOffice   MovieName boxPer movieDay sumBoxOffice                 time
Irank
1      15277.55       羞羞的铁拳  53.28        6    101344.33  2017-10-05 21:00:38
2       3717.96        英伦对决  12.97        6     33417.61  2017-10-05 21:00:38
3       3544.68          追龙  12.36        6     27479.24  2017-10-05 21:00:38
4       2389.96       缝纫机乐队   8.33        7     17470.01  2017-10-05 21:00:38
5       1557.94         空天猎   5.43        7     17617.31  2017-10-05 21:00:38
6        490.06  那一场呼啸而过的青春   1.71        1       642.29  2017-10-05 21:00:38
7        376.30  钢铁飞龙之再见奥特曼   1.31        5      2893.68  2017-10-05 21:00:38
8        304.96      看不见的客人   1.06       21     15355.52  2017-10-05 21:00:38
9        292.49     昆塔:反转星球   1.02        5      3401.08  2017-10-05 21:00:38
10       270.14  猩球崛起3:终极之战   0.94       21     73049.05  2017-10-05 21:00:38
11       453.48          其它   1.00        0         0.00  2017-10-05 21:00:38
******************************
27479.24
******************************
Out[9]:
  sumBoxOffice  boxPer
3   17470.01    8.33
4   17617.31    5.43
5   642.29      1.71
对于DataFrame的旋转,可用stack()或unstack()函数来实现。stack()是指将columns与value从竖向对应变为横向对应,而unstack()是将columns变为纵向展示,每个columns内部有index去对应其内容。比如说:
In [10]:
d = {'one' : pd.Series([1., 2., 3.], index=['a', 'b', 'c']),'two' : pd.Series([1., 2., 3., 4.], index=['a', 'b', 'c', 'd'])}
df = pd.DataFrame(d)
df['three']=df.one+df.two
print df
df.stack()

   one  two  three
a    1    1      2
b    2    2      4
c    3    3      6
d  NaN    4    NaN
Out[10]:
a  one      1
   two      1
   three    2
b  one      2
   two      2
   three    4
c  one      3
   two      3
   three    6
d  two      4
dtype: float64
In [11]:
df.unstack()
Out [11]:
one    a     1
       b     2
       c     3
       d   NaN
two    a     1
       b     2
       c     3
       d     4
three  a     2
       b     4
       c     6
       d   NaN
dtype: float64
除了用loc()去选取位置,还可以用iloc()去定位。iloc()中的i是指int,是按照位置来选取内容的意思,而不是根据key来,比如说要选取第3行第2列的数据:
In [12]:
df.iloc[3,2]
   one  two  three
a    1    1      2
b    2    2      4
c    3    3      6
d  NaN    4    NaN
Out[12]:
nan
选0-2行,第2列:
In[13]
df.iloc[0:3,1]
   one  two  three
a    1    1      2
b    2    2      4
c    3    3      6
d  NaN    4    NaN
Out[13]:
a    1
b    2
c    3
Name: two, dtype: float64

#还可以实现更多效果:
#print df.iloc[1,1]选取第二行,第二列的值,返回的为单个值
#print df.iloc[[0,2],:]选取第一行及第三行的数据
#print df.iloc[0:2,:]选取第一行到第三行(不包含)的数据,注意不包含2
#print df.iloc[:,1]选取所有记录的第一列的值,返回的为一个Series
#print df.iloc[1,:]选取第一行数据,返回的为一个Series,原来的列名变成索引
实际上,除了loc()和iloc(),更常用的函数是ix()函数,因为可以混用标签和索引。
此外,可以根据布尔值来进行筛选:
In [14]:
df.two>2
   one  two  three
a    1    1      2
b    2    2      4
c    3    3      6
d  NaN    4    NaN
Out[14]:
a    False
b    False
c     True
d     True
Name: two, dtype: bool
通过对大于2的数据进行判断,结果为真则返回True。然后我们可以将结果为True的数据筛选出来:
In [15]:
df[df.two>2]
   one  two  three
a    1    1      2
b    2    2      4
c    3    3      6
d  NaN    4    NaN
Out[15]:
    one two three
c   3   3   6
d   NaN 4   NaN
如果还需再细选某一列,则可结合ix()进行操作:
In [16]
print df
df.ix[df.two>2,'three']
   one  two  three
a    1    1      2
b    2    2      4
c    3    3      6
d  NaN    4    NaN
Out[16]:
c     6
d   NaN
Name: three, dtype: float64
若对多个条件进行判断,也是可以的:
In [17]:
print df
df[(df.two>1)&(df.three<5)]
   one  two  three
a    1    1      2
b    2    2      4
c    3    3      6
d  NaN    4    NaN
Out[17]:
    one two three
b   2   2   4
值得注意的是,我们可将返回的布尔值变为数字,例如:
In [18]:
(df.two>1)*1
   one  two  three
a    1    1      2
b    2    2      4
c    3    3      6
d  NaN    4    NaN
Out[18]:
a    0
b    1
c    1
d    1
Name: two, dtype: int32
于是,筛选的方式可扩展为df[(df.two>1)*1+(df.three<5)*1==2],返回的结果将与df[(df.two>1)&(df.three<5)]一致。扩展方式的好处是,可以筛选出在n个条件中至少满足x个条件的结果。
- 空缺处理
把数据变成空值,可用df.ix[0,0]=np.nan。实际应用中,有些数据不准确,但我们不知道真实数据是多少,为了防止对统计结果的影响,我们需要将这种数据变为nan,这样统计的时候即可自动忽略该不准确值。
如果知道真实值,也可直接添加,比如df.ix[0,0]=1。
若要将所有空值填充,可用fillna()函数,要填充的内容填写在括号内,比如df.fillna(1)。fillna()函数还能定义填充的方法,有ffill和bfill两种,前者用上一个值填充,后者用下一个值填充,若头尾为空,则不填充,内容仍为nan。实现方式为df.fillna(method='ffill')。
输入df.fillna(method='ffill')后,返回的是修改后的样子,原数据并没有变。若要改变原数据,则还需要加上inplace=True,比如df.fillna(method='ffill',inplace=True)
要判断内容是否为空值,可用isnull()函数,比如:
In [19]:
df.isnull()
   one  two  three
a    1    1      2
b    2    2      4
c    3    3      6
d  NaN    4    NaN
Out[19]:
    one     two     three
a   False   False   False
b   False   False   False
c   False   False   False
d   True    False   True
算一算有多少个空值:
In[20]:
print df
print df.isnull()*1
print np.sum(df.isnull()*1,axis=0) #axis=0意味着按列相加,axis=1意味着按行相加
np.sum(df.isnull()*1,axis=1) !=0
   one  two  three
a    1    1      2
b    2    2      4
c    3    3      6
d  NaN    4    NaN
   one  two  three
a    0    0      0
b    0    0      0
c    0    0      0
d    1    0      1
one      1
two      0
three    1
dtype: int64
Out[20]:
a    False
b    False
c    False
d     True
dtype: bool
- 排序
根据key来排序,可用sort_values(by='xxx',ascending=False)函数,表示对xxx列进行降序排序。ascending是升序,为假即为降序。其中,by=可以省略不写,Python能看懂的。不写ascending的话,默认为升序排序。
求频数可用value_couns()函数,比如:
In[21]:
print df
print df.one.value_counts()

   one  two  three
a    1    1      2
b    2    2      4
c    3    3      6
d  NaN    4    NaN
3    1
2    1
1    1
Name: one, dtype: int64
还可用sort_index对横轴或纵轴进行排序,比如:
In[22]:
print df
df.sort_index(axis=0, ascending=False)
   one  two  three
a    1    1      2
b    2    2      4
c    3    3      6
d  NaN    4    NaN
Out[22]:
    one two three
d   NaN 4   NaN
c   3   3   6
b   2   2   4
a   1   1   2
对两列进行排序,跟excel的方式是一样的:
In[23]
print df
df.sort_values(['two','three'],ascending=[0,1])
#0代表False,降序,1代表True,升序。
#two按降序排序,three按升序排序。排多列的时候先排前面的,前面的一样的时候再排后面的three
   one  two  three
a    1    1      2
b    2    2      4
c    3    3      6
d  NaN    4    NaN
Out[23]:
    one two three
d   NaN 4   NaN
c   3   3   6
b   2   2   4
a   1   1   2
- 索引
前面提到可用set_index()函数将column变为index,若要反过来,将index变为column也是可以的,这时用到reset_index()函数。同样,reset后返回的结果只是做做样子,要改变原数据内容,则需在括号内加上inplace=True
In[24]:
print df
print '*'*30
df.set_index('one')
print df.reset_index()
print '*'*30
print df

   one  two  three
a    1    1      2
b    2    2      4
c    3    3      6
d  NaN    4    NaN
******************************
  index  one  two  three
0     a    1    1      2
1     b    2    2      4
2     c    3    3      6
3     d  NaN    4    NaN
******************************
   one  two  three
a    1    1      2
b    2    2      4
c    3    3      6
d  NaN    4    NaN
在Python中,a=1,b=a的运算结果是,把b指向a,实际上并没有对变量b赋予具体的值,而matlab会。如果要强行赋予b一个等于1的值,则需要用到copy()函数。所以,当用set_index或reset_index时,需要将值赋予新的变量:
In[25]:
#人工方法
print df
print '*'*30
df.set_index('one')
print df.reset_index()
df2=df.reset_index()
print '*'*30
print df
print df2
   one  two  three
a    1    1      2
b    2    2      4
c    3    3      6
d  NaN    4    NaN
******************************
  index  one  two  three
0     a    1    1      2
1     b    2    2      4
2     c    3    3      6
3     d  NaN    4    NaN
******************************
   one  two  three
a    1    1      2
b    2    2      4
c    3    3      6
d  NaN    4    NaN
  index  one  two  three
0     a    1    1      2
1     b    2    2      4
2     c    3    3      6
3     d  NaN    4    NaN


#copy()函数法
In[26]:
df1=df.copy() #把df的值实实在在地赋予了df1
df1.set_index('one',inplace='True')
print df #df还是df
df1 #df1与df各走各路

   one  two
a    1    1
b    2    2
c    3    3
d  NaN    4
Out[26]:
    two
one
1   1
2   2
3   3
NaN 4
7.其他补充
- 求最大值
用max(),括号内填1,则求行,为0则求列。比如:
In[27]:
print df
df.max(0)
   one  two  three
a    1    1      2
b    2    2      4
c    3    3      6
d  NaN    4    NaN
Out[27]:
one      3
two      4
three    6
dtype: float64
- 求均值
用mean(),括号内填1,则求行,为0则求列。
- 求描述性统计
用describe(),但只能对列做汇总,若要求行,则先转置再求,比如df.T.describe()。
- 每列数据非循环语句的单独运算
用apply(lambda x: 表达式)函数,比如说:
In[28]:
print df
df.apply(lambda x: x.max()-x.min())
   one  two  three
a    1    1      2
b    2    2      4
c    3    3      6
d  NaN    4    NaN
Out[28]:
one      2
two      3
three    4
dtype: float64

#转置一下也是可以的
In[29]:
print df
df.T.apply(lambda x: x.max()-x.min())
   one  two  three
a    1    1      2
b    2    2      4
c    3    3      6
d  NaN    4    NaN
Out[29]:
a    1
b    2
c    3
d    0
dtype: float64
- 插入列并赋值
把index的内容填充进新增列内:
In[30]:
print df
df['four']=df.index
df
   one  two  three
a    1    1      2
b    2    2      4
c    3    3      6
d  NaN    4    NaN
Out[30]:
   one  two three four
a   1   1   2   a
b   2   2   4   b
c   3   3   6   c
d   NaN 4   NaN d
- 更改列名
用rename()函数,比如:
In[31]:
print df
df.rename(columns={'two':'2'},inplace=True)
df
   one  two  three
a    1    1      2
b    2    2      4
c    3    3      6
d  NaN    4    NaN
Out[31]:
    one 2   three
a   1   1   2
b   2   2   4
c   3   3   6
d   NaN 4   NaN
- 变更列数据的类型
可用astype()函数,比如:
In[32]:
print df
df['one']=df['one'].astype('str') #把第一列数据的类型变为字符串
df.dtypes
   one  two  three
a    1    1      2
b    2    2      4
c    3    3      6
d  NaN    4    NaN
Out[32]:
one       object
two      float64
three    float64
dtype: object
查看每列的数据类型可用df.dtypes命令。
- 回归分析
假设对one和two两列数据做回归分析:
In [33]:
d = {'one' : pd.Series([1., 2., 3.,4.], index=['a', 'b', 'c','d']),'two' : pd.Series([3., 4., 5., 6.], index=['a', 'b', 'c', 'd'])}
df = pd.DataFrame(d)
df['three']=df.one+df.two
print df
x=df['one']
y=df['two']
import matplotlib.pyplot as plt
import statsmodels.api as sm
x=sm.add_constant(x)
df.dtypes
result=sm.OLS(y,x).fit()
result.params
   one  two  three
a    1    3      4
b    2    4      6
c    3    5      8
d    4    6     10
Out[33]:
const    2
one      1
dtype: float64
结语
至此,我们已对Pandas的基础内容有所熟悉。在金融数据处理中,我们将依靠Pandas的帮助,分析出市场中的投资机会。进阶学习强大的金融数据分析工具——Pandas,敬请期待。
刺猬偷腥
2017年10月6日
to be continued.