使用Prometheus+Grafana搭建监控系统(一)
1.前言
在线上业务中经常遇到服务器负载过高问题,由于没有监控,一直没发现,直到业务方反馈网站打开速度慢,才能发现问题。这样显得开发很被动。因那次考虑研究搭建一套监控系统了。
本身对于spring boot应用,可以使用spring boot admin进行监控,但是发现不够全面,
调研了一段时间,发现Prometheus+Grafana还是可以监控,如下是系统流程图。
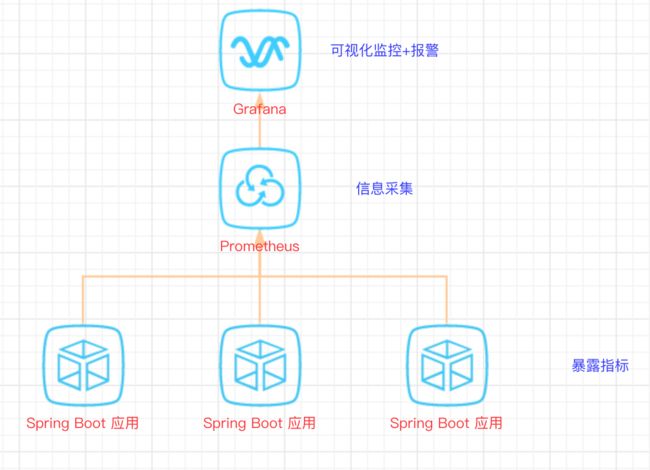
本文就主要记录mac下搭建的过程。
1.1Prometheus简介:
Prometheus是一个开源的系统监控和报警的工具包,最初由SoundCloud发布。
- 特点:
1.多维数据模型(有metric名称和键值对确定的时间序列)
2.灵活的查询语言
3.不依赖分布式存储
4.通过pull方式采集时间序列,通过http协议传输
5.支持通过中介网关的push时间序列的方式
6.监控数据通过服务或者静态配置来发现
7.支持图表和dashboard等多种方式 - 组件:
Prometheus 主程序,主要是负责存储、抓取、聚合、查询方面。
Alertmanager 程序,主要是负责实现报警功能。
Pushgateway 程序,主要是实现接收由Client push过来的指标数据,在指定的时间间隔,由主程序来抓取。
*_exporter 这类是不同系统已经实现了的集成。
时间序列化数据库,我的理解就是将数据打上标签,以时间维度存储。后面有机会在深入研究。
1.2 Grafana简介
grafana 是一款采用 go 语言编写的开源应用,主要用于大规模指标数据的可视化展现,基于商业友好的 Apache License 2.0 开源协议。
在网络架构和应用分析中最流行的时序数据展示工具,并且也在工业控制、自动化监控和过程管理等领域有着广泛的应用
grafana有热插拔控制面板和可扩展的数据源,已经支持绝大部分常用的时序数据库
包含以下:Graphite、Elasticsearch、CloudWatch、InfluxDB、OpenTSDB、Prometheus
2.准备含prometheus的springBoot应用
1、Spring Boot 应用暴露监控指标【版本 1.5.7.RELEASE】
首先,添加依赖如下依赖:
    io.prometheus
    simpleclient_spring_boot
    0.1.0


    org.springframework.cloud
    spring-cloud-starter-eureka


    org.springframework.boot
    spring-boot-starter-actuator
然后,在启动类 Application.java 添加如下注解:
@SpringBootApplication
@EnablePrometheusEndpoint
@EnableSpringBootMetricsCollector
public class Application {

    public static void main(String[] args) {
        SpringApplication.run(Application.class, args);
    }

}
最后,配置默认的登录账号和密码,在 application.yml 中:
management:
  security:
    enabled: false
spring:
  application:
    name: microservice-prometheus
server:
  port: 8888
启动应用后访问:http://localhost:8888/prometheus 可以看到相关监控信息
3.安装prometheus
从https://prometheus.io/download/ 选择合适的版本进行下载,
此处下载的为prometheus-2.2.1.darwin-amd64.tar.gz
解压tar zxvf prometheus-2.2.1.darwin-amd64.tar.gz
进入prometheus,执行cd prometheus
配置prometheus.yml
global:
  scrape_interval: 10s
  scrape_timeout: 10s
  evaluation_interval: 10m
scrape_configs:
  - job_name: spring-boot
    scrape_interval: 5s
    scrape_timeout: 5s
    metrics_path: /prometheus
    scheme: http
    basic_auth:
      username: user
      password: pwd
    static_configs:
      - targets:
        - 127.0.0.1:8888 #此处填写 Spring Boot 应用的 IP + 端口号
启动prometheus
./prometheus -config.file=prometheus.yml
默认端口为:9090
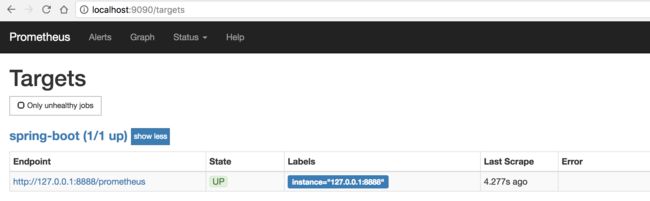
打开管理页面:http://localhost:9090/targets
4.安装grafana
4.1 grafana安装
安装步骤参考grafana官方文档:http://docs.grafana.org/installation/mac/
使用brew进行安装
brew update
brew install grafana
配置位置: /usr/local/etc/grafana/grafana.ini
日志位置:/usr/local/var/log/grafana/grafana.log
插件位置:/usr/local/var/lib/grafana/plugins
sqlite数据库位置: /usr/local/var/lib/grafana
启动服务:brew services start grafana
停止服务:brew services stop grafana
默认端口:3000
启动后访问http://127.0.0.1:3000/ 配置 Prometheus 数据源
默认grafana的用户名密码为admin/admin
4.2 grafana配置
首先需要创建一个数据源,这里选择type为Prometheus的数据源,名称为springboot
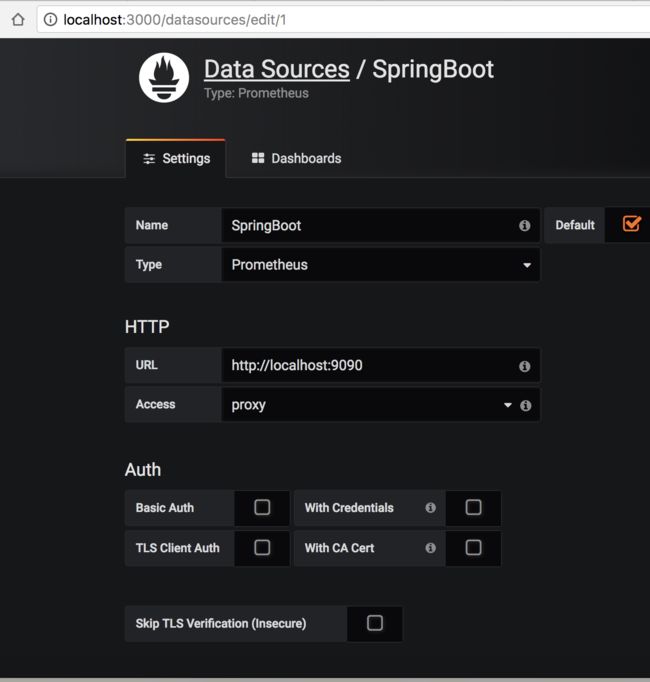
当看到datasource is working的提示时候,表明你的prometheus工作是正常的。
接着回到首页,添加一个dashboard,配置单个指标的可视化监控面板:
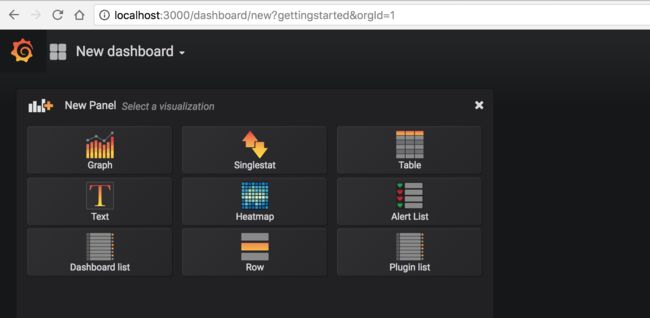
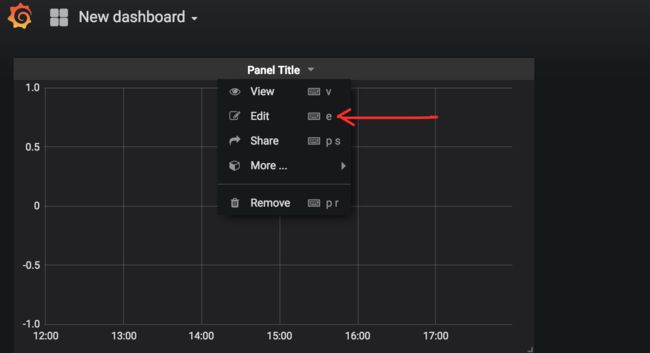
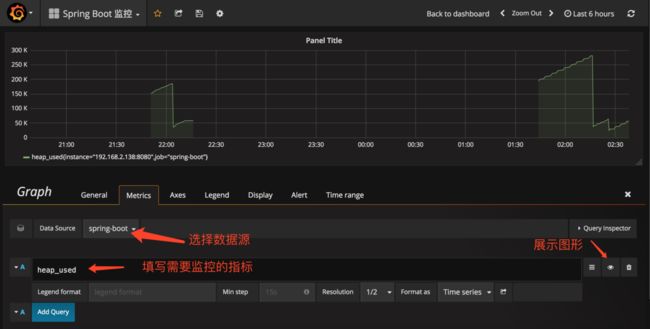
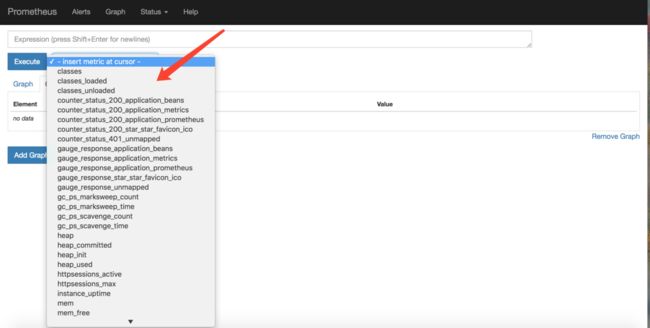
提示,此处填写需要监控的指标不能任意填写,只能填已有的指标点,具体的可以监控的指标在 Prometheus 的首页看到,即 http://localhost:9090/graph
注意在相关出的重命名操作,方便理解。
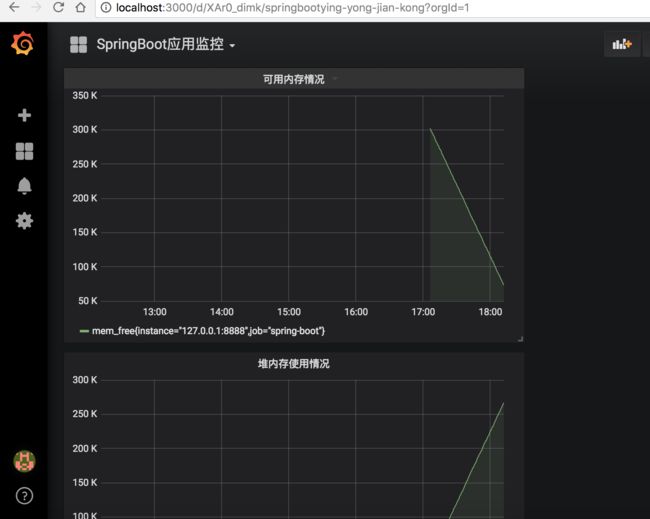
多配置几个指标之后,即可有如下效果:
参考文档:
https://prometheus.io/docs/introduction/overview/
http://docs.grafana.org/installation/mac/
http://www.spring4all.com/article/265
欢迎大家扫码关注我的微信公众号,与大家一起分享技术与成长中的故事。