参考资料
chapter2
Training Machine Learning Algorithms for Classifcation
引言:
在第一章初步介绍了三种类型的机器学习以及他们的各自的特点后,在本章,我们将学习第一类神经网络(监督式学习),并用Python搭建出一个简单的二元分类的神经网络单元,用于在鸢尾花的数据集Iris dataset中分类出花的种类,在本章的学习中我们需要做到以下三点
**
• Building an intuition for machine learning algorithms
• Using pandas, NumPy, and matplotlib to read in, process, and visualize data
• Implementing linear classifcation algorithms in Python**
友情提示:需要现行接触一下 numpu pandas 的基本函数
本人就是没有接触过所以为了看懂代码花了很久_(:3」∠)
section 1: 人工神经单元以及二分类线性模型
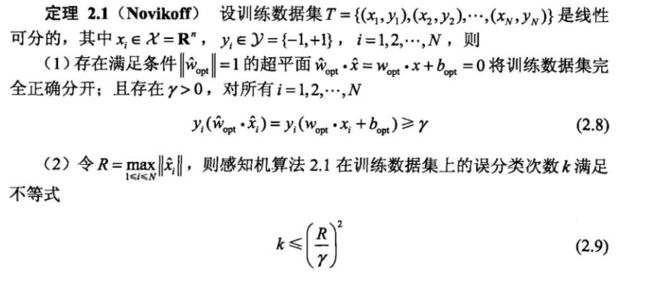
感知机的Novikofff定理
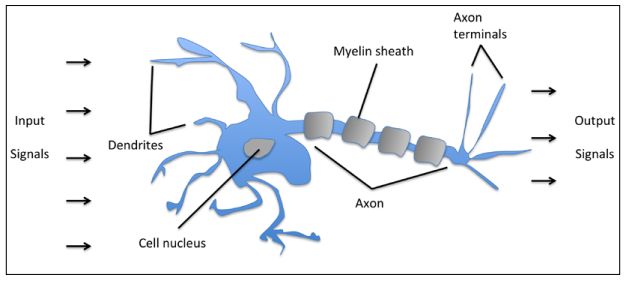
人工神经单元参考了神经元的设计
输入信号


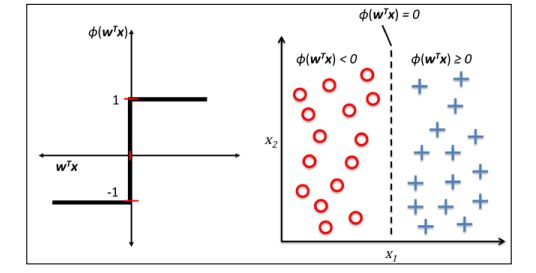
激励函数(输出)
激励函数(activation function)中,对输进行了加权求和之后的net_input,如果大于指定的阈值θ,则输出为1,否则为-1
稍微修改一下 令
这样我们输入一组信号x,输出的信号被分成了两类,这就是分类算法的原理
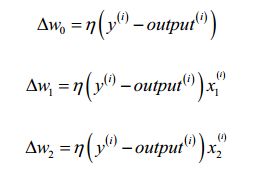
权值的更新法则如下
举个例子
现在,基本的原理已经交代完毕,我们可以用Python实现了
section 2: Python 实现
step 1: Perceptron 类
首先,我们建立一个二元划分的类,方便以后调用,这个类应该包含一个更新权值并统计误差的方法,一个计算加权求和net_input的方法,以及一个用激励函数判断输出的方法,包含一个属性权值属性,一个误差属性,我们在一个文件中单独编写这个类
书上的代码写得很详细,我加入了一些额外的注释
__author__ = 'Administrator'
#! /usr/bin/python
 # -*- coding:utf8 -*-
import numpy as np
class Perceptron(object):
    """
    Perceptron classifier.
    Parameters(参数)
    ------------
    eta : float
    Learning rate (between 0.0 and 1.0) 学习效率
    n_iter : int
    Passes over the training dataset(数据集).
    Attributes(属性)
    -----------
    w_ : 1d-array
    Weights after fitting.
    errors_ : list
    Number of misclassifications in every epoch(时间起点).
    """

    def __init__(self, eta=0.01, n_iter=10):
        self.eta = eta
        self.n_iter = n_iter
    def fit(self, X, y):
        '''
    Fit training data.
    Parameters
    ----------
    X : {array-like}, shape = [n_samples, n_features] X的形式是列矩阵
    Training vectors, where n_samples is the number of samples
    and n_features is the number of features.
    y : array-like, shape = [n_samples]
    Target values.
    Returns
    -------
    self : object
'''
        self.w_ = np.zeros(1 + X.shape[1])
        # zeros()创建了一个 长度为 1+X.shape[1] = 1+n_features 的 0数组
        #初始化权值为0
        # self.w_ 权向量
        self.errors_ = []
        for _ in range(self.n_iter):
            errors = 0
            for xi, target in zip(X,y):
                update = self.eta * (target - self.predict(xi))
                self.w_[1:] += update * xi
                self.w_[0] += update #更新权值,x0 =1
                errors += int(update != 0.0)
            self.errors_.append(errors) #每一步的累积误差
        return self

    def net_input(self, X):
        """Calculate net input"""
        return (np.dot(X, self.w_[1:])+self.w_[0])

    def predict(self, X):
        """return class label after unit step"""
        return np.where(self.net_input(X) >= 0.0, 1, -1)
step 2: 读取数据集,调用类,绘图
我们在主文件中编写下面的代码
__author__ = 'Administrator'
#! /usr/bin/python
 # -*- coding: utf8 -*-
import pandas as pd
import matplotlib.pyplot as plt
import numpy as np
from perceptron import Perceptron
from PDC import plot_decision_regions
import requests

#从url下载文件
filename = 'Iris.csv'
url = 'https://archive.ics.uci.edu/ml/machine-learning-databases/iris/iris.data'
# urllib.request.urlretrieve(url, filename)

df = pd.read_csv(filename,header=None)# 返回一种DataFrame结构文件,DataFrame,pandas中的一种数据结构
print(df.tail())                    # 验证是否读取正确

#.iloc[0:100,4] 读取前100行的序号为4(第5列数据)
y = df.iloc[0:100, 4].values # .values将dataframe中的值存进一个list中
y = np.where(y=='Iris-setosa',-1,1) #如果是 Iris-setosa y=-1否则就是1 (二元分类)

X = df.iloc[0:100,[0,2]].values

#.iloc[0:100,[0:2]] 读取前100行的 前两列的数据

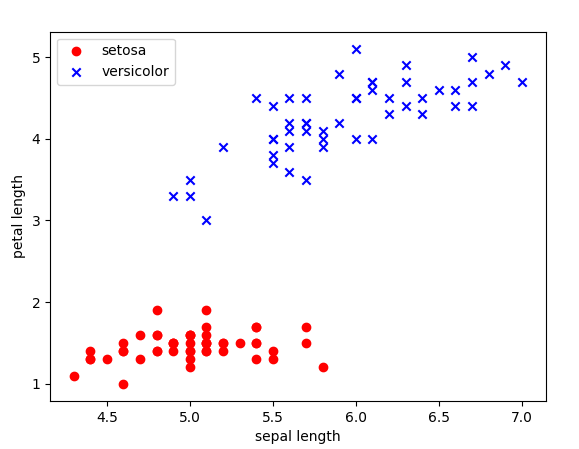
plt.scatter(X[:50,0],X[:50,1],c='red',marker='o',label='setosa')
plt.scatter(X[50:100,0],X[50:100,1],c='blue',marker='x',label='versicolor')
plt.xlabel('sepal length')
plt.ylabel('petal length')
plt.legend(loc='upper left')
plt.show()
可以看出 数据十分鲜明的被分成了两类
step 3: 调用Perceptron类 进行学习
我们在主文件中继续追加如下代码
ppn = Perceptron(eta=0.1,n_iter=10)
ppn.fit(X, y)
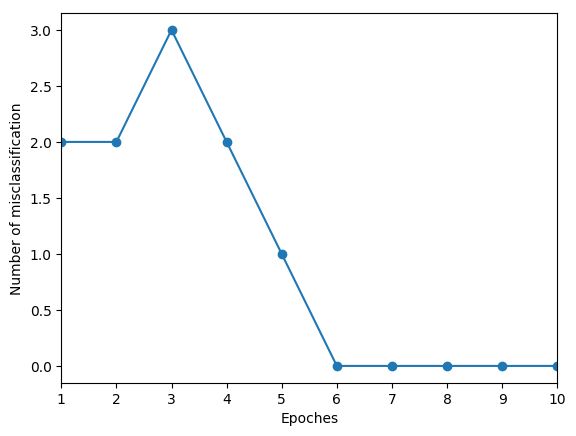
plt.plot(range(1, len(ppn.errors_)+1), ppn.errors_, marker='o')
plt.xlabel('Epoches')
plt.ylabel('Number of misclassification')
plt.xlim(1,10)
plt.savefig('Number of misclassification-Epoches.png',bbox_inches='tight')
plt.show()
可以看到,误差收敛到0了,说明学习的效果很好
step 4 :可视化
我们在一个文件中单独编写一个函数,把数据可视化
__author__ = 'Administrator'
#! usr/bin/python
 # -*- coding:utf8 -*-

from matplotlib.colors import ListedColormap
import matplotlib.pyplot as plt
import numpy as np
from perceptron import Perceptron
def plot_decision_regions(X, y, classifier, resolution=0.02):
    #setup marker generator and colormap
    markers = ('o','x','s','^','v')
    colors = ('red','blue','lightgreen','gray','cyan')
    cmap = ListedColormap(colors[: len(np.unique(y))])
    # plot the decision surface
    x1_min, x1_max = X[:,0].min() -1, X[:,0].max()+1
    x2_min, x2_max = X[:,1].min() -1, X[:,1].max()+1
    # X[:,k] 冒号左边表示行范围,读取所有行,冒号右边表示列范围,读取第K列
    xx1, xx2 = np.meshgrid(np.arange(x1_min,x1_max,resolution),
                           np.arange(x2_min,x2_max,resolution))
    #arange(start,end,step) 返回一个一维数组
    #meshgrid(x,y)产生一个以x为行,y为列的矩阵
    #xx1是一个(305*235)大小的矩阵 xx1.ravel()是将所有的行放在一个行里面的长度71675的一维数组
    #xx2同理
    Z = classifier.predict(np.array([xx1.ravel(), xx2.ravel()]).T) #我们其实调用predict()方法预测了grid矩阵当中的每一个点
    #np.array([xx1.ravel(), xx2.ravel()]) 生成了一个 (2*71675)的矩阵
    # xx1.ravel() = (1,71675)
    #xx1.shape = (305,205) 将Z重新调整为(305,205)的格式
    Z = Z.reshape(xx1.shape)

    plt.contourf(xx1, xx2, Z, alpha=0.4, cmap=cmap)

    plt.xlim(xx1.min(), xx1.max())
    plt.ylim(xx2.min(), xx2.max())

    # plot class samples
    print(np.unique(y))
    # idx = 0,1 cl = -1 1
    for idx, cl in enumerate(np.unique(y)):
        plt.scatter(x=X[y==cl, 0], y=X[y==cl, 1],
                    alpha=0.8, c=cmap(idx),
                    marker = markers[idx],label = cl)
在主程序中调用它
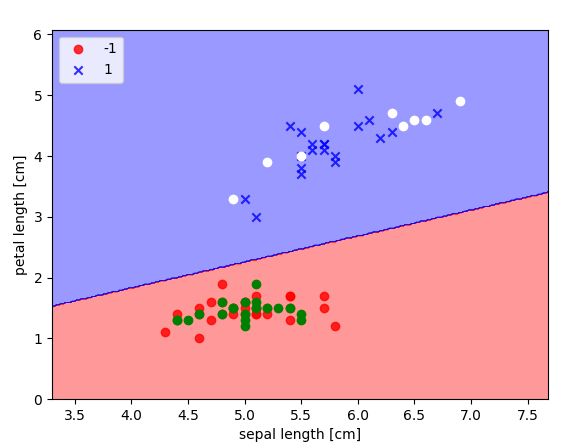
plot_decision_regions(X,y,classifier=ppn)
plt.xlabel('sepal length [cm]')
plt.ylabel('petal length [cm]')
plt.legend(loc = 'upper left')
plt.savefig(' decision_regions.png')
plt.show()
应用
书中的训练集包含Iris.csv文件中两种花所有的样本,为了让我们这个神经网络模型的分类效果更明显,我们选取一部分样本作为训练集,另一部分样本作为预测的数据
在主程序中,我们做出这样的更改
#更改训练集
#更改训练集
y1 = df.iloc[0:30, 4].values # .values将dataframe中的值存进一个list中
x1 = df.iloc[0:30,[0,2]]
y2 = df.iloc[80:100, 4].values
x2 = df.iloc[80:100,[0,2]]
y = np.hstack((y1,y2)) # 水平追加
X = np.vstack((x1,x2)) #竖直追加
y = np.where(y=='Iris-setosa',-1,1) #如果是 Iris-setosa y=-1否则就是1 (二元分类)
X2 = df.iloc[30:60,[0,2]].values
抓取20个第一类花的样本以及10个第二类花的样本组成训练集
训练
ppn = Perceptron(eta=0.1,n_iter=10)
ppn.fit(X, y) #训练
预测
#预测
print(ppn.predict(X2))
plot_decision_regions(X,y,classifier=ppn)
plt.scatter(X2[0:20:,0], X2[0:20,1],c='g')
plt.scatter(X2[21:30:,0], X2[21:30,1],c='w')
plt.xlabel('sepal length [cm]')
plt.ylabel('petal length [cm]')
plt.legend(loc = 'upper left')

# plt.savefig(' decision_regions.png')
plt.show()
这里用到了矩阵的切片
X2[0:20:,0]
表示 X2 的第0到第20行,所有列 中的第0列
我们看一看预测的结果
跟预计的相同,说明神经网络分类的效果很好
