1,目的
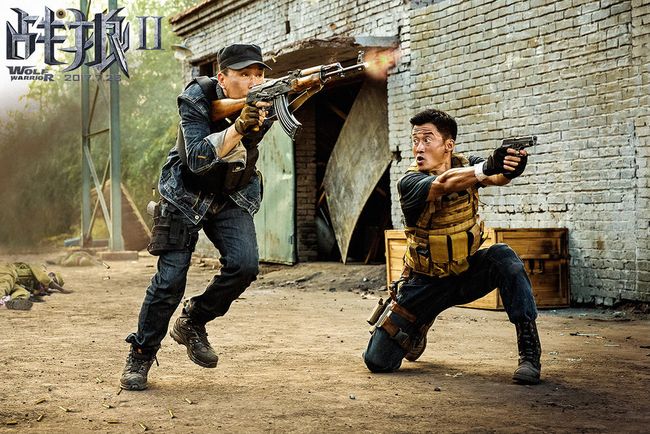
将logo图标叠加到一张图片的右上角,要求有颜色的区域为不透明,例如将阿里影业的Logo叠加到战狼2的海报上,原始图和效果图如下。
img_target.png
2,思路
不同的logo有不同的处理方法,有的是黑色需要透明,有的是白色需要透明,但是,整理的思路是一致的。
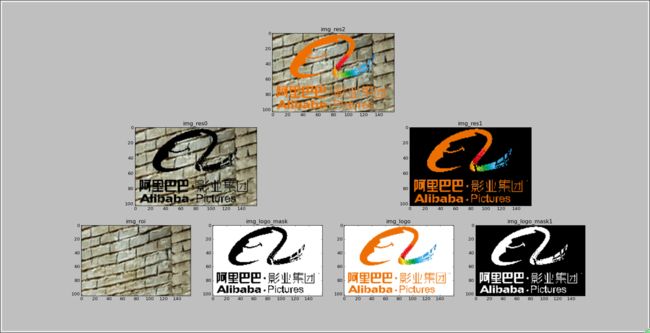
如下图所示,从上向下,对要形成的效果进行分解,一共分为3层。
- 第一层需要第二层的两张图片,做cv2.add运算即可
- 第二层第一张图片需要第三层前两张图片,做cv2.bitwise_and运算即可,后一张做mask
- 第二层第二张图片需要第三层后两张图片,做cv2.bitwise_and运算即可,后一张做mask
在分解过程中,需要思考和明确要调用的OpenCV函数。如果一步解决不了,就拆分成多步解决。
3,步骤分析
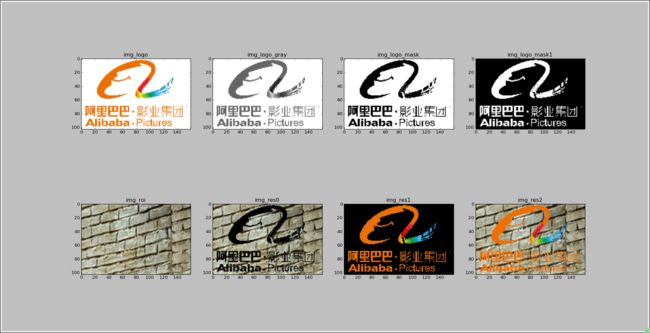
基于上述思路,制定详细的图像处理步骤,并进行编码调试。处理步骤如下图所示。
3.1,读取logo图片,并对logo按照20%进行缩放
img_logo = cv2.imread("d:/1/ali-movie.png", cv2.IMREAD_COLOR)
img_logo = cv2.resize(img_logo, (0, 0), fx=0.2, fy=0.2, interpolation=cv2.INTER_NEAREST)
3.2,对logo进行灰度化处理,得到两个mask
img_logo_gray = cv2.cvtColor(img_logo, cv2.COLOR_BGR2GRAY)
ret, img_logo_mask = cv2.threshold(img_logo_gray, 200, 255, cv2.THRESH_BINARY)  # 二值化函数
img_logo_mask1 = cv2.bitwise_not(img_logo_mask)
3.3,提取目标图片的ROI
img_target = cv2.imread("d:/1/wolf.jpg", cv2.IMREAD_COLOR)
rows, cols, channel = img_logo.shape
rows1, cols1, channel1 = img_target.shape
img_roi = img_target[:rows, cols1 - cols:cols1].copy()
3.4,ROI和Logo图像融合
img_res0 = cv2.bitwise_and(img_roi, img_roi, mask=img_logo_mask)
img_res1 = cv2.bitwise_and(img_logo, img_logo, mask=img_logo_mask1)
img_res2 = cv2.add(img_res0, img_res1)
# img_res2 = img_res0 + img_res1
img_target[:rows, cols1 - cols:cols1] = img_res2[:, :]
cv2.imwrite("img_target.png", img_target)
4,疑难点介绍
4.1,cv2.add与矩阵相加的区别
测试程序
import numpy as np
import cv2
x = np.uint8([250])
y = np.uint8([10])
print cv2.add(x,y)   #输出# [[255]]
print x+y            #输出# [4]  (250+10)%255
测试结论
- cv2.add方法和numpy矩阵相加,都可以完成两张图片的相加运算
- numpy矩阵相加是模运算
- cv2.add是渗透运算,如果元素之和大于255,则按照255返回,可以直接相加两张图片试试效果,代码和效果图如下所示
img_logo = cv2.imread("d:/1/ali-movie.png", cv2.IMREAD_COLOR)
img_target = cv2.imread("d:/1/wolf.jpg", cv2.IMREAD_COLOR)
print img_logo.shape, img_target.shape
img_new_add = cv2.add(img_target[:516, :798], img_logo[:516, :798])
cv2.imshow("img_new_add", img_new_add)
cv2.waitKey(0)
cv2.destroyAllWindows()
4.2,matplotlib的subplot简单介绍
代码如下,效果图如method of img deal.png所示。
- 代码
# 显示图片,调用matplotlib展示
plt.figure()
plt.subplot(332), plt.imshow(img_convert(img_res2), cmap='gray'), plt.title("img_res2")
plt.subplot(323), plt.imshow(img_convert(img_res0), cmap='gray'), plt.title("img_res0")
plt.subplot(324), plt.imshow(img_convert(img_res1), cmap='gray'), plt.title("img_res1")
plt.subplot(3, 4, 9), plt.imshow(img_convert(img_roi), cmap='gray'), plt.title("img_roi")
plt.subplot(3, 4, 10), plt.imshow(img_convert(img_logo_mask), cmap='gray'), plt.title("img_logo_mask")
plt.subplot(3, 4, 11), plt.imshow(img_convert(img_logo), cmap='gray'), plt.title("img_logo")
plt.subplot(3, 4, 12), plt.imshow(img_convert(img_logo_mask1), cmap='gray'), plt.title("img_logo_mask1")
plt.show()
- 效果图
5,源码奉上
# coding:utf8

import numpy as np
import cv2
from matplotlib import pyplot as plt


# 图像处理,将logo图标叠加到一张图片的右上角,要求有颜色的区域为不透明
def img_deal():
    # 1,对logo进行缩放,按照20%进行
    img_logo = cv2.imread("d:/1/ali-movie.png", cv2.IMREAD_COLOR)
    img_logo = cv2.resize(img_logo, (0, 0), fx=0.2, fy=0.2, interpolation=cv2.INTER_NEAREST)
    # cv2.imshow("img_logo", img_logo)

    # 2,对logo做清洗,白色区域是255,其他区域置为黑色0
    img_logo_gray = cv2.cvtColor(img_logo, cv2.COLOR_BGR2GRAY)
    ret, img_logo_mask = cv2.threshold(img_logo_gray, 200, 255, cv2.THRESH_BINARY)  # 二值化函数
    img_logo_mask1 = cv2.bitwise_not(img_logo_mask)
    # cv2.imshow("img_logo_gray", img_logo_gray)
    # cv2.imshow("img_logo_mask", img_logo_mask)

    # 3,提取目标图片的ROI
    img_target = cv2.imread("d:/1/wolf.jpg", cv2.IMREAD_COLOR)
    rows, cols, channel = img_logo.shape
    rows1, cols1, channel1 = img_target.shape
    img_roi = img_target[:rows, cols1 - cols:cols1].copy()
    # cv2.imshow("img_roi", img_roi)

    # 4,ROI和Logo图像融合
    img_res0 = cv2.bitwise_and(img_roi, img_roi, mask=img_logo_mask)
    img_res1 = cv2.bitwise_and(img_logo, img_logo, mask=img_logo_mask1)
    img_res2 = cv2.add(img_res0, img_res1)
    # img_res2 = img_res0 + img_res1
    img_target[:rows, cols1 - cols:cols1] = img_res2[:, :]
    cv2.imwrite("img_target.png", img_target)

    # 显示图片,调用opencv展示
    # cv2.imshow("img_res0", img_res0)
    # cv2.imshow("img_res1", img_res1)
    # cv2.imshow("img_res2", img_res2)
    # cv2.imshow("img_target", img_target)
    # cv2.waitKey(0)
    # cv2.destroyAllWindows()

    # 显示图片,调用matplotlib展示
    plt.figure()
    titles = ["img_logo", "img_logo_gray", "img_logo_mask", "img_logo_mask1", "img_roi", "img_res0", "img_res1",
              "img_res2"]
    imgs = [img_logo, img_logo_gray, img_logo_mask, img_logo_mask1, img_roi, img_res0, img_res1, img_res2]
    for x in xrange(len(imgs)):
        plt.subplot(241 + x), plt.imshow(img_convert(imgs[x]), cmap='gray'), plt.title(titles[x])  # , plt.axis('off')
    plt.show()

    # 显示图片,调用matplotlib展示
    plt.figure()
    plt.subplot(332), plt.imshow(img_convert(img_res2), cmap='gray'), plt.title("img_res2")
    plt.subplot(323), plt.imshow(img_convert(img_res0), cmap='gray'), plt.title("img_res0")
    plt.subplot(324), plt.imshow(img_convert(img_res1), cmap='gray'), plt.title("img_res1")
    plt.subplot(3, 4, 9), plt.imshow(img_convert(img_roi), cmap='gray'), plt.title("img_roi")
    plt.subplot(3, 4, 10), plt.imshow(img_convert(img_logo_mask), cmap='gray'), plt.title("img_logo_mask")
    plt.subplot(3, 4, 11), plt.imshow(img_convert(img_logo), cmap='gray'), plt.title("img_logo")
    plt.subplot(3, 4, 12), plt.imshow(img_convert(img_logo_mask1), cmap='gray'), plt.title("img_logo_mask1")
    plt.show()


# cv2与matplotlib的图像转换,cv2是bgr格式,matplotlib是rgb格式
def img_convert(cv2_img):
    # 灰度图片直接返回
    if len(cv2_img.shape) == 2:
        return cv2_img
    # 3通道的BGR图片
    elif len(cv2_img.shape) == 3 and cv2_img.shape[2] == 3:
        b, g, r = cv2.split(cv2_img)
        return cv2.merge((r, g, b))
    # 4通道的BGR图片
    elif len(cv2_img.shape) == 3 and cv2_img.shape[2] == 4:
        b, g, r, a = cv2.split(cv2_img)
        return cv2.merge((r, g, b, a))
    # 未知图片格式
    else:
        return cv2_img


# 主函数
if __name__ == "__main__":
    img_deal()
6,参考页面
OpenCV-Python教程:8.图片的算术运算
http://www.jianshu.com/p/4c4b4e651989opencv documentation
http://docs.opencv.org/3.0-alpha/index.html
