一. 可视化项目工具
1. d3
D3 is a JavaScript data visualization library for HTML and SVG. It aims to brings data to life, and emphasizes web standards, combining powerful visualization techniques with a data-driven approach to Document Object Model (DOM)manipulation. D3 is the most popular data visualization project on Github by a wide margin, and is well-represented in the data science community.
2. Chart.js
Chart.js is an HTML5 library that brings visualization via the element. Chart.js promotes itself as simple & flexible, is interactive, and supports 6 different chart types.
3. Leaflet
Leaflet is a JavaScript library for the creation of mobile-friendly interactive maps. Its code is incredibly small, and Leaflet is designed with the goals of simplicity, performance, and usability. Doesn't have the functionality you want out of the box? Leaflet is also extensible via a whole host of plugins.
4. ECharts
ECharts is a browser-based charting and visualization library. Like other libraries on this list, it aims to be easy to use and flexible, as well as intuitive and highly customizable. Also like many others, ECharts is a JavaScript library; however, it is based on zrender, an original canvas library designed for 2D charts.
5. Chartist-js
Chartist is... it's becoming a bit repetitive at this point. JavaScript. Check. Lightweight. Check. And this is not a knock on Chartist; most of these libraries are just very similar, at least at their core. Chartist sets itself apart, however, in the following manner: Chartist does not rely on canvas, and puts an emphasis on responsiveness. It also (as per its own description) tries to be less annoying than other options.
6. Sigma.js
Sigma is a JavaScript library which focuses on graph drawing. Sigma allows developers to develop graph representations on webpages, and integrate these networks into web applications. The resulting networks are attractive, and support interaction.
7. Metrics-graphics
MetricsGraphics.js is, you guessed it, a JavaScript library, which is built on top of D3, another JavaScript library. MetricsGraphics is optimized for time-series data, which is a differentiating aspect. It's code base is particularly small, forcing it to be principled. A number of standard graphic types are supported, including line charts, scatterplots, histograms, bar charts and more.
8. DC.js
DC.js is dimensional charting built on D3.js to work natively with crossfilter. DC.js renders in CSS friendly SVG format. It is meant for powerful data analysis in the browser as well as on the mobile device.
9. Epoch
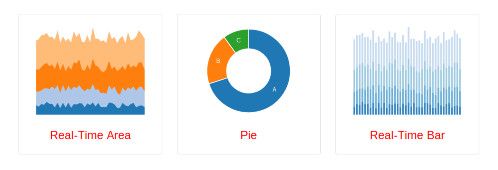
Epoch is a general purpose library for developers and visualization designers. It is general purpose, and supports 2 distinct aspects of visualization: basic charts for historical data reporting, and real-time charts for displaying frequently updating time-series data. Epoch is a JavaScript project.
10. Vega
Vega is a visualization grammar. Vega provides a manner for creating and saving interactive visualization designs, in a declarative format. Data visualizations are described in JSON format. Interactive views are generated using either HTML5 Canvas or SVG.
These projects are predominantly JavaScript-based, and as such are geared toward web development and browser-based data visualization. There is no doubt that this is an increasingly-important aspect of data viz, and data science in general. If you are interested in Python visualization tools, see the relateditems below.
其他,有待查找
- 一共56个,盘点最实用的大数据可视化分析工
- 10 Best Data Visualization Projects of 2015
- 数字冰雹

- 30 个最好的数据可视化工具推荐
二. 管理驾驶舱
1. 北京小学大学
2. fineBI
3. 大数据可视化的绝妙案例:互联网地图,浩瀚宇宙中的网站“星球”
三. 企业信息源
1. 天眼查
2. 信用视界
3. 企查查
四. 计算机企业排名
- 2015年财富世界500强排行榜
- 2015中国互联网企业100强
五. 知名计算机公司##
- 百度
百度(Nasdaq:BIDU)是全球最大的中文搜索引擎、最大的中文网站。2000年1月由李彦宏创立于北京中关村,致力于向人们提供“简单,可依赖”的信息获取方式。“百度”二字源于中国宋朝词人辛弃疾的《青玉案·元夕》词句“众里寻他千百度”,象征着百度对中文信息检索技术的执著追求。
2015年1月24日,百度创始人、董事长兼CEO李彦宏在百度2014年会暨十五周年庆典上发表的主题演讲中表示,十五年来,百度坚持相信技术的力量,始终把简单可依赖的文化和人才成长机制当成最宝贵的财富,他号召百度全体员工,向连接人与服务的战略目标发起进攻。2015年11月18日,百度与中信银行发起设立百信银行。
- 阿里