PNChart
去年项目中用到了折线图,当时因为项目赶的紧,于是下载了GitHub上排行前几名的图表框架,看一下哪一个与需求最符,最后选择了PNChart(个人感觉当初的选择还是很正确的,因为框架只能满足一些基本功能,其他的滑动、触摸、悬浮框,交集点都是需要自己改框架的,PNChart里面的代码还是挺简洁的),直到年后过了这么长时间稍微闲下来才决定看一看里面具体的实现方法。
首先PNChart无论用什么初始化方法在内部全部调用了setupDefaultValues,在这个方法里面初始化了一堆变量,同时初始化了上下左右四个边距为25.当调用setChartData,首先初始化了数组,同时设置了CAShapeLayer的一些属性,然后调用了prepareYLabelsWithData方法。
prepareYLabelsWithData方法主要是为了找出Y轴上的最大值与最小值,并且如果_showGenYLabels为真,那么调用setYLabels方法。setYLabels方法主要是用来设置Y轴上的Label的frame,同时给它赋值。当上面的步骤走完之后调用setNeedsDisplay,系统会调用drawRect方法,如果isShowCoordinateAxis为YES,即如果显示坐标轴,那么先画坐标轴,画坐标轴的的时候先画的是Y轴,然后才画X轴,注意起点和画Y轴的时候这个起点跟_chartMarginBottom有关,要注意它是可以更改的,后面又画了Y轴和X轴的箭头。
同时如果showLabel为YES,那么会画X轴和Y轴上的小突起(即每一步的突出的那个点),如果xUnit和yUnit是有值的,那么会在X轴和Y轴旁边画一个Label并赋值,如果showYGridLines为YES,即网格线显示,那么,但是在画网格线要注意一个问题如果_showLabel为YES,那么网格线的起点不是靠着最左边的,会有默认值10,当为NO是,默认值为0,所以可以在代码里面更改。同时在这一块还控制了网格线是虚线还是实现,当网格线默认为虚线,可以更改为实线,只要把那里面的数值更改一下(简单来说在drawRect方法里面画了坐标轴和坐标轴的箭头以及上面的小突起,还有旁边的Label还有网格线)
当调用strokeChart的时候,首先在方法内部调用了一个方法,这个方法的主要作用是根据折线的类型来画折线(先算出X轴和Y轴的位置,然后画相应的线),其实这个折线是默认有动画的,可以设置displayAnimated属性为NO来让不让有动画
自己绘制简单的折线图
1.首先设置变量的默认值
-(void)createDefaultValue
{
    _nowIndex = 1;
    _dataArray = [NSMutableArray array];
    _lineLayer = [CAShapeLayer layer];
    [_lineLayer setLineCap:kCALineCapRound];
    [_lineLayer setLineJoin:kCALineJoinRound];
    [_lineLayer setLineWidth:1];
    [_lineLayer setStrokeColor:[UIColor blackColor].CGColor];
    [_lineLayer setFillColor:[UIColor clearColor].CGColor];

    _maskLayer = [CAShapeLayer layer];
    _gradientLayer = [CAGradientLayer layer];
    _gradientLayer.frame = self.bounds;//必须设置渐变涂层的frame,不然渐变涂层出不来

    _gradientLayer.colors = @[(__bridge id)[UIColor redColor].CGColor,(__bridge id)[UIColor whiteColor].CGColor];
    _gradientLayer.startPoint = CGPointMake(0, 0);
    _gradientLayer.endPoint = CGPointMake(0, 1);

    for (int i = 0; i < totalCount; i ++) {
        CGFloat lineW = (self.width - LeftDistance*2)/totalCount;
        CGFloat linex = LeftDistance + lineW/2.0 + i*lineW;
        NSInteger w = (self.height - LeftDistance*2 - 60);
        CGFloat liney = arc4random()% w;
        CGPoint point = CGPointMake(linex, liney);
        [_dataArray addObject:[NSValue valueWithCGPoint:point]];
    }
}
然后绘制折线图的边框和虚线
-(void)drawRect:(CGRect)rect
{
    CGContextRef context = UIGraphicsGetCurrentContext();
    [[UIColor blackColor]setStroke];
    CGContextSetLineCap(context, kCGLineCapSquare);
    CGContextSetLineJoin(context, kCGLineJoinRound);
    CGContextSetLineWidth(context, 1);
    CGRect lineRect = CGRectMake(LeftDistance, LeftDistance, self.width - LeftDistance*2, self.height - LeftDistance*2);
    CGContextAddRect(context, lineRect);
    CGContextStrokePath(context);

    CGFloat lineW = (self.width - LeftDistance*2)/LineCount;
    CGFloat lineH = (self.height - LeftDistance*2)/LineCount;

    for (int i = 0; i < LineCount; i ++) {
        CGFloat dash[] = {10,2};
        CGContextSetLineDash(context, 0, dash, 2);
        CGContextMoveToPoint(context, LeftDistance, LeftDistance + (i+1)*lineH);
        CGContextAddLineToPoint(context, self.width - LeftDistance , LeftDistance + (i+1)*lineH);
        CGContextStrokePath(context);
    }

    for (int i = 0; i < LineCount; i ++) {
        CGFloat dash[] = {10,2};//当把2改为0的时候其实虚线就变为了实线
        CGContextSetLineDash(context, 0, dash, 2);
        CGContextMoveToPoint(context, LeftDistance + (i +1)*lineW, LeftDistance );
        CGContextAddLineToPoint(context, LeftDistance + (i +1)*lineW, self.height - LeftDistance);
        CGContextStrokePath(context);
    }
}
最后根据数据和类型绘制不同的折线
-(void)strokeLinePath
{
    if (_type == lineAnimation || _type == lineAnimationNone || _type == lineFillAnimationNone) {
        UIBezierPath *path = [UIBezierPath bezierPath];
        for (int i = 0; i < _dataArray.count; i ++) {
            CGPoint point = [_dataArray[i] CGPointValue];
            if(i == 0)
            {
                [path moveToPoint:point];
            }else
            {
                [path addLineToPoint:point];
            }
        }
        _lineLayer.path = path.CGPath;
        [self.layer addSublayer:_lineLayer];
        //简单的折线图到这里已经绘制完毕
        if (_type == lineAnimation) {
            CABasicAnimation *animate = [CABasicAnimation animationWithKeyPath:@"strokeEnd"];
            animate.fromValue = @0;
            animate.toValue = @1;
            animate.duration = 4;
            [_lineLayer addAnimation:animate forKey:@"strokeEnd"];
        }//给折线图添加动画
        if (_type == lineFillAnimationNone) {
            CGPoint lastPoint = [_dataArray[totalCount -1] CGPointValue];
            CGPoint firstPoint = [_dataArray[0] CGPointValue];
            [path addLineToPoint:CGPointMake(lastPoint.x, self.height - LeftDistance)];
            [path addLineToPoint:CGPointMake(LeftDistance, self.height - LeftDistance)];
            [path addLineToPoint:firstPoint];
            _maskLayer.path = path.CGPath;
            _gradientLayer.mask = _maskLayer; //最关键是这一句,设置渐变涂层的mask
            [self.layer addSublayer:_gradientLayer];


            //其实这一种还有令一种实现,即:
//            CGPoint lastPoint = [_dataArray[totalCount -1] CGPointValue];
//            CGPoint firstPoint = [_dataArray[0] CGPointValue];
//            [path addLineToPoint:CGPointMake(lastPoint.x, self.height - LeftDistance*2)];
//            [path addLineToPoint:CGPointMake(LeftDistance, self.height - LeftDistance*2)];
//            [path addLineToPoint:firstPoint];
//            UIBezierPath *fillPath = [UIBezierPath bezierPathWithCGPath:path.CGPath];
//            CAShapeLayer *fillLayer = [CAShapeLayer layer];
//            [fillLayer setLineCap:kCALineCapRound];
//            [fillLayer setLineJoin:kCALineJoinRound];
//            [fillLayer setLineWidth:1];
//            [fillLayer setStrokeColor:[UIColor clearColor].CGColor];
//            [fillLayer setFillColor:[UIColor orangeColor].CGColor];
//            fillLayer.path = fillPath.CGPath;
//            [self.layer addSublayer:fillLayer];
        } //带渐变实心色的折线图
    }else
    {
    _timer = [NSTimer timerWithTimeInterval:3.0/_dataArray.count repeats:YES block:^(NSTimer * _Nonnull timer) {
        UIBezierPath *path = [UIBezierPath bezierPath];
        CGPoint firstPoint = [_dataArray[0] CGPointValue];
        CGPoint nextPoint = [_dataArray[_nowIndex] CGPointValue];
        [path moveToPoint:firstPoint];
        for (int i = 0; i < _dataArray.count; i ++) {
            if (_nowIndex < i) {
                break;
            }
            if (_nowIndex != 0) {
                CGPoint point = [_dataArray[i] CGPointValue];
                [path addLineToPoint:point];
            }
        }

        _lineLayer.path = path.CGPath;
        [self.layer addSublayer:_lineLayer];

        [path addLineToPoint:CGPointMake(nextPoint.x, self.height -LeftDistance)];
        [path addLineToPoint:CGPointMake(firstPoint.x, self.height - LeftDistance)];
        [path addLineToPoint:firstPoint];

        _maskLayer.path = path.CGPath;
        _gradientLayer.mask = _maskLayer;
        [self.layer addSublayer:_gradientLayer];

        _nowIndex ++ ;
        if (_nowIndex == _dataArray.count) {
            [_timer invalidate];
        }
    }];
        [[NSRunLoop currentRunLoop]addTimer:_timer forMode:NSDefaultRunLoopMode];
    }//渐变实心的折线图带动画

}
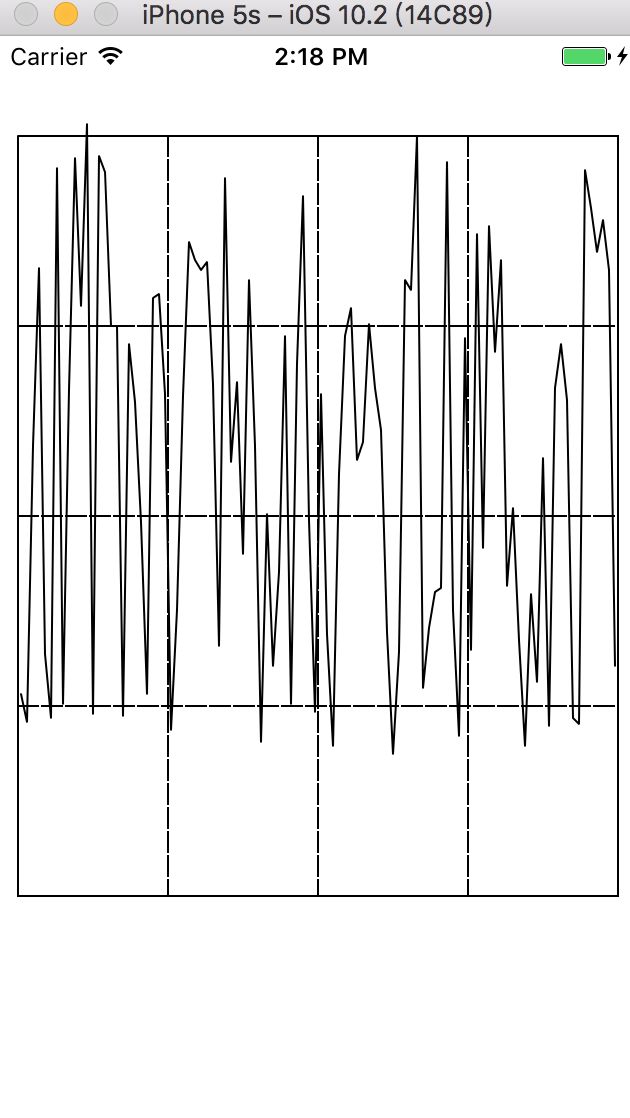
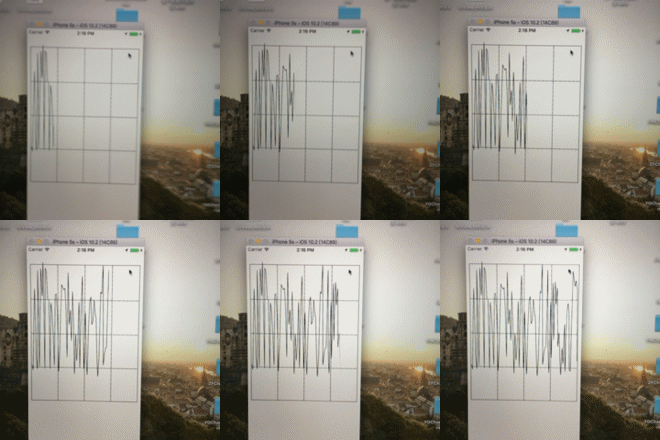
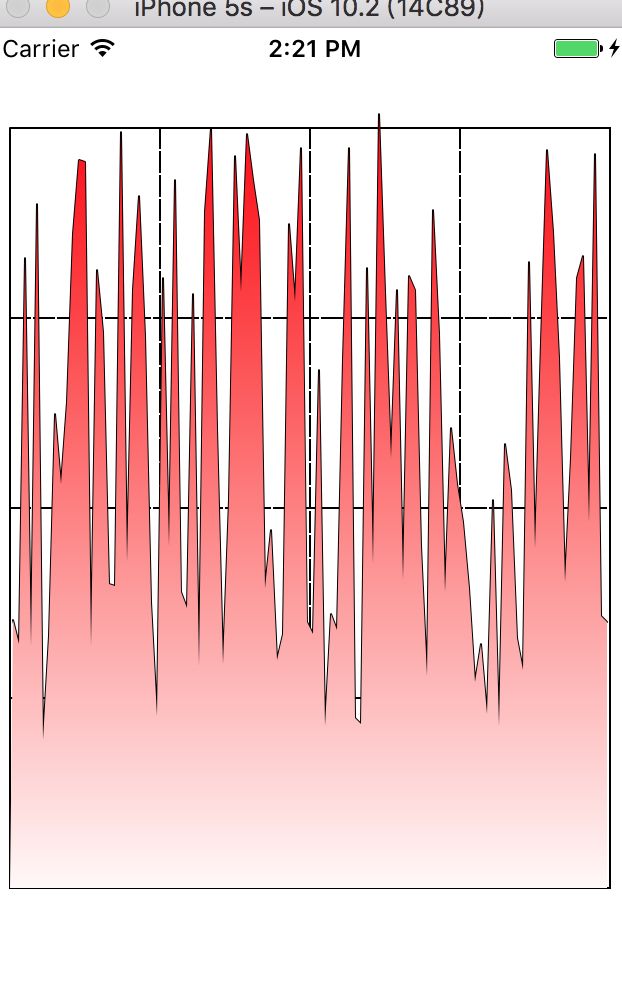
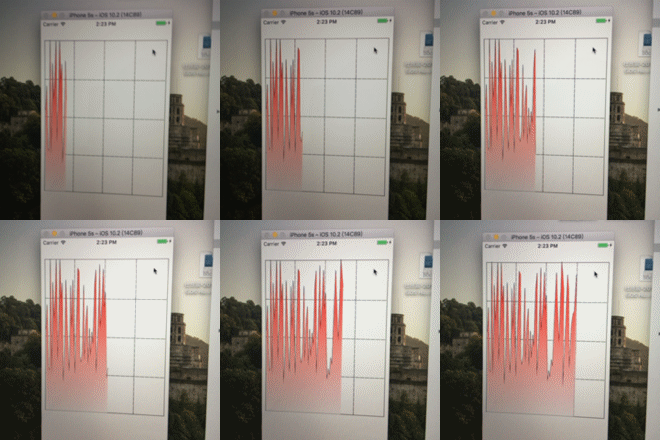
实现的效果:
(1)折线图没有动画(即lineAnimationNone)
(2)折线图有动画
(3)折线图带渐变色不带动画(即lineFillAnimationNone)
(4)折线图实心带渐变色和动画(即lineFillAnimation)
小结:这是自己写的一个简单折线图的不同类型,但是最后一个折线图带渐变色和动画的是有问题的,因为当数据源不同的时候这个动画的时间也会不一样,我当时取巧用一个固定的时间去除以数据源,但是出来的效果还是跟原先没多少区别,所以最后一种类型还是只是作为参考,希望各位有什么好的办法实现可以告诉我。


