《Modern Statistics for Modern Biology》Chapter 一: 离散数据模型的预测(1.1 - 1.3)
《Modern Statistics for Modern Biology》Chapter 一: 离散数据模型的预测(1.4 - 1.5)
《Modern Statistics for Modern Biology》Chapter 二: 统计建模(2.1-2.3)
《Modern Statistics for Modern Biology》Chapter 二: 统计建模(2.4-2.5)
《Modern Statistics for Modern Biology》Chapter 二 统计建模(2.6 - 2.7)
《Modern Statistics for Modern Biology》Chapter 二 统计建模(2.8 - 2.9)
《Modern Statistics for Modern Biology》Chapter 二 统计建模(2.10 完结)
《Modern Statistics for Modern Biology》Chapter 三:R语言中的高质量图形(3.1-3.4)
《Modern Statistics for Modern Biology》Chapter 三:R语言中的高质量图形(3.5-3.6)
从这章开始最开始记录一些markdown等小知识
$\hat{p}=\frac{1}{12}$:
掌握R语言中的apply函数族
卡方检验
Hardy-Weinberg equilibrium( 哈迪-温伯格平衡 )
带你理解beta分布
简单介绍一下R中的几种统计分布及常用模型
- 统计分布每一种分布有四个函数:
d――density(密度函数),p――分布函数,q――分位数函数,r――随机数函数。比如,正态分布的这四个函数为dnorm,pnorm,qnorm,rnorm。下面我们列出各分布后缀,前面加前缀d、p、q或r就构成函数名:norm:正态,t:t分布,f:F分布,chisq:卡方(包括非中心)unif:均匀,exp:指数,weibull:威布尔,gamma:伽玛,beta:贝塔lnorm:对数正态,logis:逻辑分布,cauchy:柯西,binom:二项分布,geom:几何分布,hyper:超几何,nbinom:负二项,pois:泊松signrank:符号秩,wilcox:秩和,tukey:学生化极差
如何预测一条序列是否含有CpG岛
图片输出尽量保存为矢量图
结合setNames函数与scale_fill_manual函数来指定ggplot2的填充颜色(Figure 3.13)
要善于用stat_summary来自定义函数结合ggplot2进行绘图
本章颜值担当一定要放最前面
3.7 2D可视化数据:散点图
- 查看
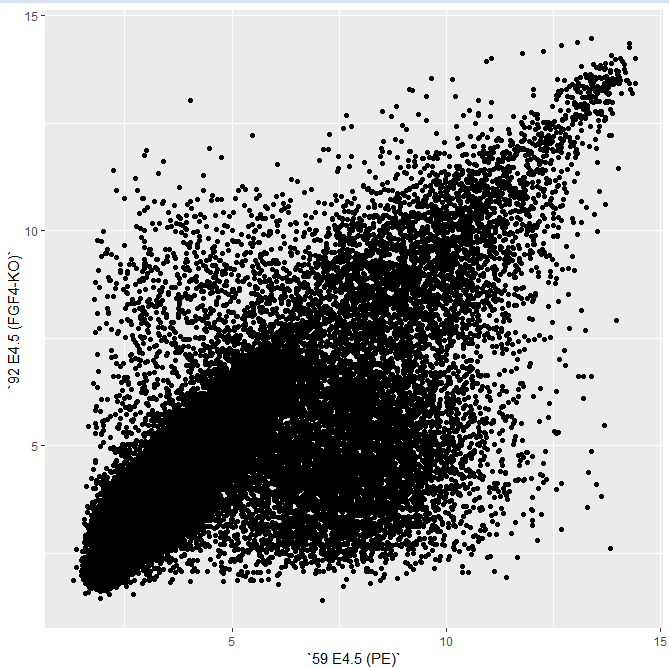
WT和FGF3-KO样本中基因的差异表达。
dfx = as.data.frame(Biobase::exprs(x))
library(ggplot2)
> scp = ggplot(dfx, aes(x = `59 E4.5 (PE)` ,
+                       y = `92 E4.5 (FGF4-KO)`))
> scp + geom_point()
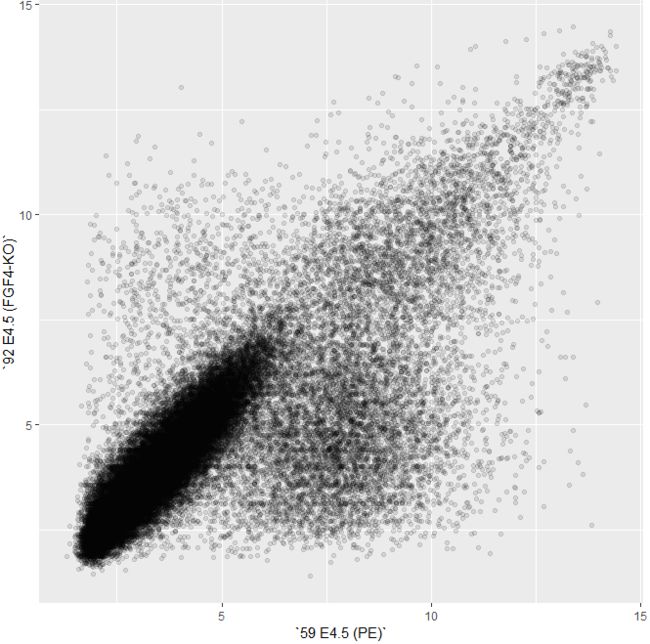
- 使用
alpha调整散点图的透明度
> scp + geom_point(alpha = 0.1)
- 另一种选择是
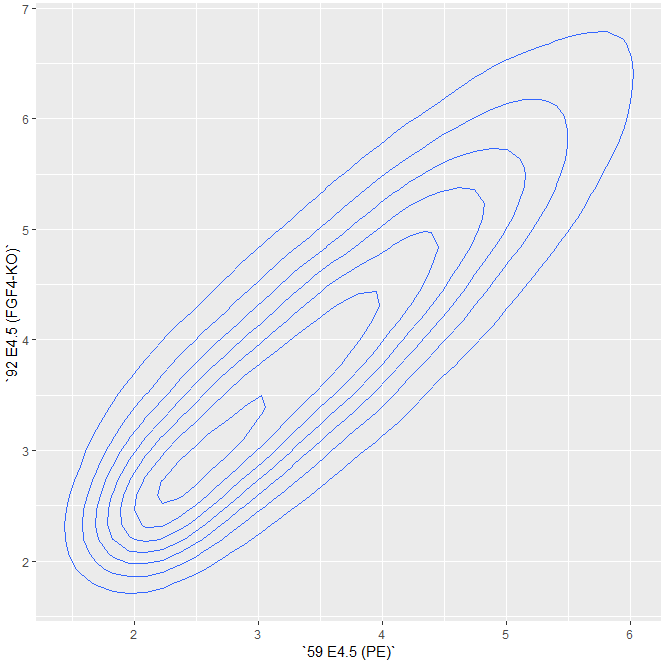
2D密度的等高线图,其具有不渲染图上所有点的附加益处。
> scp + geom_density2d()
- 但是,我们在
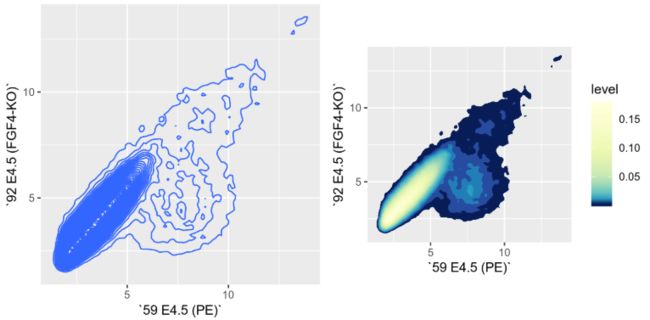
图 3.27中看到,右下角的点云(包含相对较少的点数)没有显示。我们可以通过调整geom_density2d的bandwidth和binning参数来克服这一点:
> scp + geom_density2d(h = 0.5, bins = 60)

> library("RColorBrewer")

> colorscale = scale_fill_gradientn(
+     colors = rev(brewer.pal(9, "YlGnBu")),
+     values = c(0, exp(seq(-5, 0, length.out = 100))))

> scp + stat_density2d(h = 0.5, bins = 60,
+           aes( fill = ..level..), geom = "polygon") +
+   colorscale + coord_fixed()
我们可以用
点的相对密度来填充等高线之间的每个空间,方法是调用stat_density2d函数(对于这个函数,geom_density2d是一个wrapper),并使用几何对象多边形polygon。如 图3.28右边我们使用RColorBrewer的
brewer.pal函数来定义颜色,使用coord_fixed函数来调整画图的长宽比例。
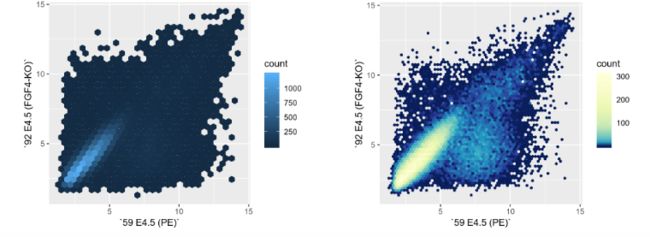
> scp + geom_hex() + coord_fixed()
Warning message:
程辑包‘hexbin’是用R版本3.5.2 来建造的
> scp + geom_hex(binwidth = c(0.2, 0.2)) + colorscale +
+   coord_fixed()
3.7.1 Plot shapes
library(ggthemes)
library(tidyverse)
sunsp <- tibble(year = time(sunspot.year),
                number = as.numeric(sunspot.year))
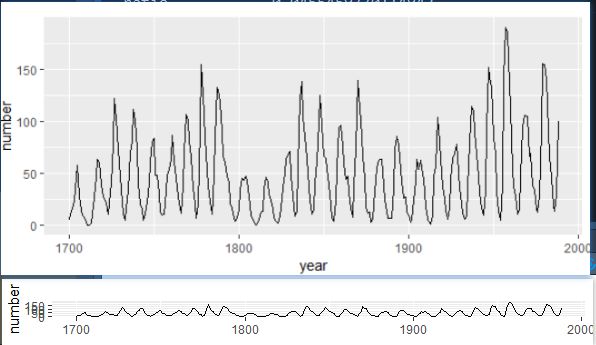
sp = ggplot(sunsp, aes(year, number)) +
  geom_line()
sp
ratio = with(sunsp, bank_slopes(year, number))
sp + coord_fixed(ratio = ratio)
3.8 两个以上的维度的可视化
-
geom_point函数的相关参数- fill
- color
- shape
- size
- alpha
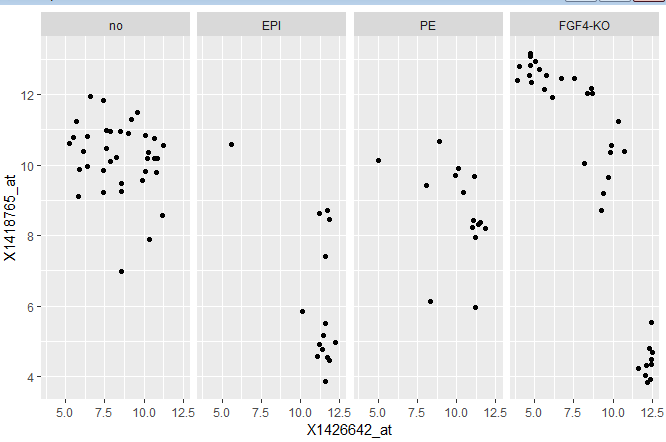
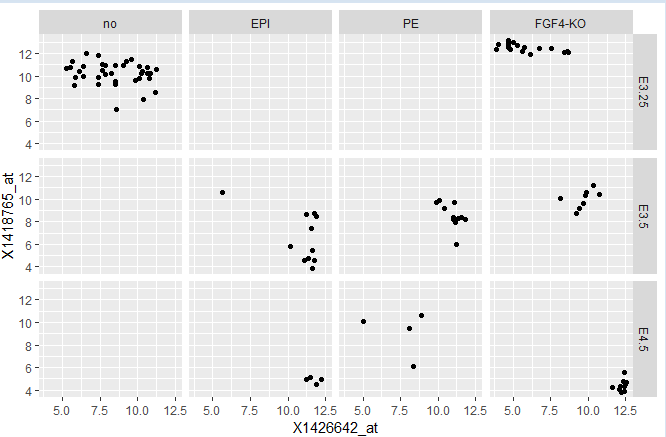
3.8.1 faceting 分面
library(magrittr)
library("Hiiragi2013")
data("x")
dftx = data.frame(t(Biobase::exprs(x)), pData(x))
dftx$lineage %<>% sub("^$", "no", .) #将空白的替换为’no'
dftx$lineage %<>% factor(levels = c("no", "EPI", "PE", "FGF4-KO")) # 变为factor
ggplot(dftx, aes(x = X1426642_at, y = X1418765_at)) +
  geom_point() +
  facet_grid(.~lineage)
ggplot( dftx, aes( x = X1426642_at, y = X1418765_at)) +
  geom_point() +
  facet_grid( Embryonic.day ~ lineage )
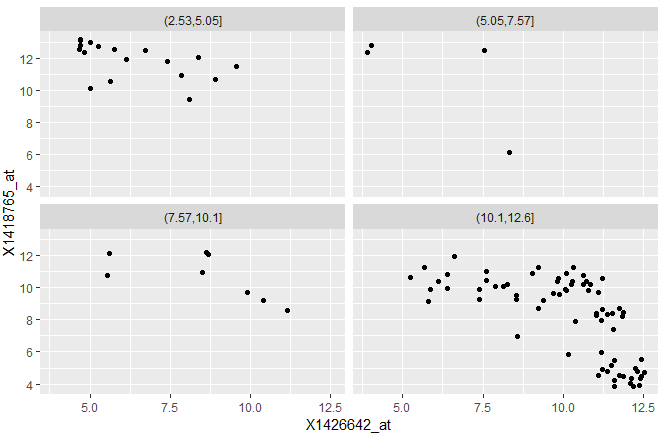
- 另外一个分面函数
facet_wrap,结合mutate函数来进行清洗可视化数据。-
cut:break = 4将数据分成四个级别
-
ggplot(mutate(dftx, Tdgf1 = cut(X1450989_at, breaks = 4)),
       aes( x = X1426642_at, y = X1418765_at)) + geom_point() +
  facet_wrap( ~ Tdgf1, ncol = 2 )
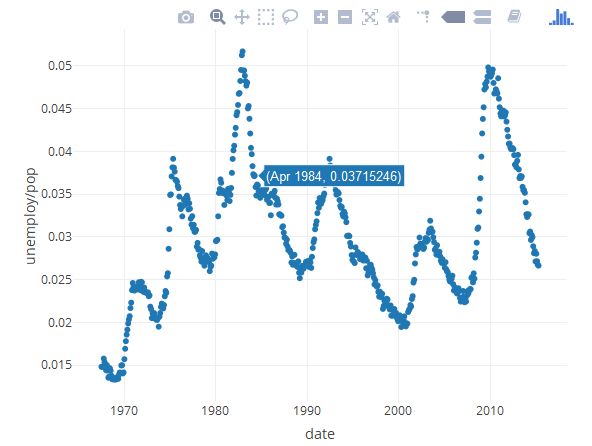
3.8.2 交互式可视化
-
shiny、ggvis、plotly、
library("plotly")
plot_ly(economics, x = ~ date, y = ~ unemploy / pop)
rgl, webgl
data("volcano")
nrow(volcano)
[1] 87

volcanoData = list(
  x = 10 * seq_len(nrow(volcano)),
  y = 10 * seq_len(ncol(volcano)),
  z = volcano,
  col = terrain.colors(500)[cut(volcano, breaks = 500)]
)
# install.packages("rgl")
library("rgl")
with(volcanoData, persp3d(x, y, z, color = col))
3.9 Color 配色
pie(rep(1, 8), col=1:8)
- 然而默认的颜色搭配是很丑的。。所以这里要引入一个包
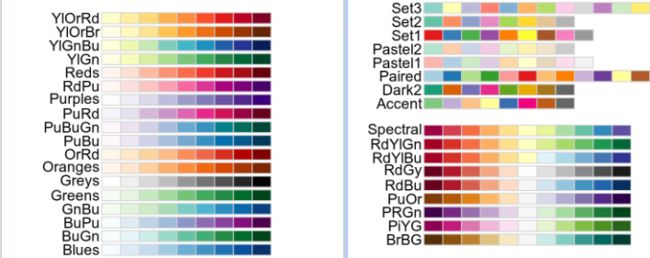
RColorBrewer。
library(RColorBrewer)
display.brewer.all() # 展示所以配色方案
head(brewer.pal.info)
     maxcolors category colorblind
BrBG        11      div       TRUE
PiYG        11      div       TRUE
PRGn        11      div       TRUE
PuOr        11      div       TRUE
RdBu        11      div       TRUE
RdGy        11      div      FALSE

table(brewer.pal.info$category)
 div qual  seq
   9    8   18

brewer.pal(4, "RdYlGn") # 查看具体的配色
[1] "#D7191C" "#FDAE61" "#A6D96A" "#1A9641"
- 如果我们需要更多的预设颜色(例如,我们可以用连续颜色绘制热图),我们可以使用
ColorRampPalette函数进行插值。
mypalette  = colorRampPalette(c("darkorange3", "white","darkblue"))(100)
head(mypalette)
[1] "#CD6600" "#CE6905" "#CF6C0A" "#D06F0F" "#D17214" "#D27519"

par(mai = rep(0.1, 4))
image(matrix(1:100, nrow = 100, ncol = 10),
      col = mypalette,
      xaxt = "n", yaxt = "n", useRaster = TRUE)
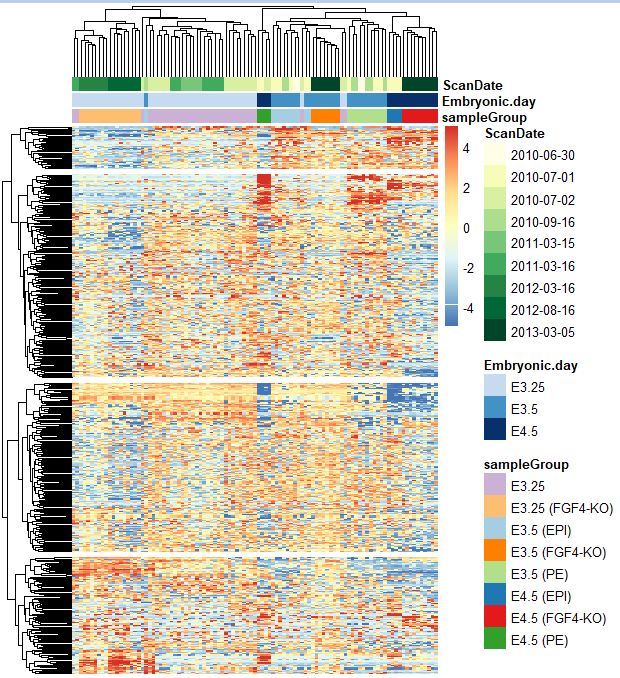
3.10 Heatmaps 热图
library("pheatmap")
topGenes = order(rowVars(Biobase::exprs(x)), decreasing = TRUE)[1:500]
head(topGenes)
[1] 33554 33434 18890  4404  2199  4405

rowCenter = function(x) { x - rowMeans(x) } ## 中心化均一化
pheatmap( rowCenter(Biobase::exprs(x)[ topGenes, ] ),
          show_rownames = FALSE, show_colnames = FALSE,
          breaks = seq(-5, +5, length = 101),
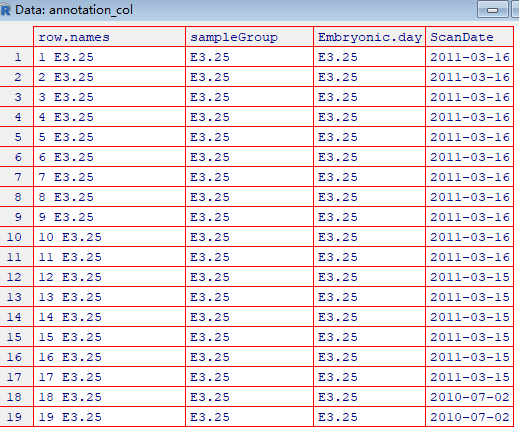
          annotation_col =
            pData(x)[, c("sampleGroup", "Embryonic.day", "ScanDate") ],
          annotation_colors = list(
            sampleGroup = groupColor,
            genotype = c(`FGF4-KO` = "chocolate1", `WT` = "azure2"),
            Embryonic.day = setNames(brewer.pal(9, "Blues")[c(3, 6, 9)],
                                     c("E3.25", "E3.5", "E4.5")),
            ScanDate = setNames(brewer.pal(nlevels(x$ScanDate), "YlGn"),
                                levels(x$ScanDate))
          ),
          cutree_rows = 4
)

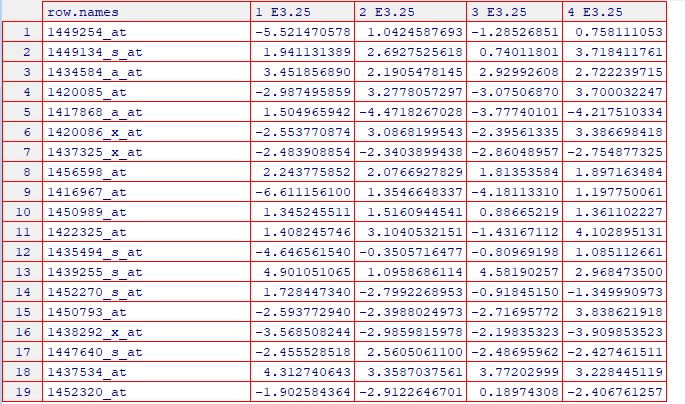
> data <- rowCenter(Biobase::exprs(x)[ topGenes, ] )
> View(data)
3.12 Mathematical symbols and other fonts
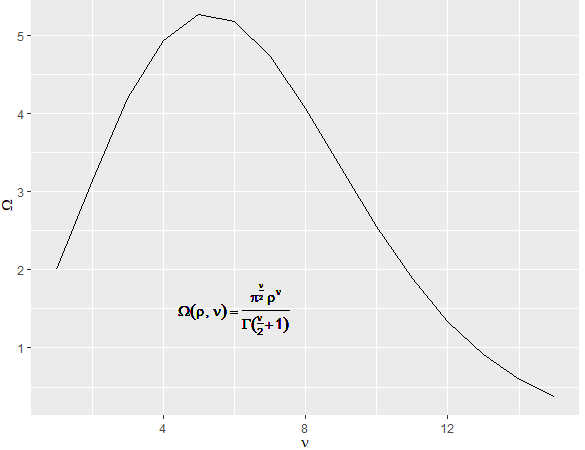
- 数学公式展示:支持
LaTeX语法
volume = function(rho, nu) pi^(nu/2) * rho^nu / gamma(nu/2+1)
ggplot(tibble(nu    = 1:15,
              Omega = volume(1, nu)), aes(x = nu, y = Omega)) +
  geom_line() +
  xlab(expression(nu)) + ylab(expression(Omega)) +
  geom_text(label =
              "Omega(rho,nu)==frac(pi^frac(nu,2)~rho^nu, Gamma(frac(nu,2)+1))",
            parse = TRUE, x = 6, y = 1.5)
library(reshape2)
genes = melt(Biobase::exprs(x)[selectedProbes, ],
             varnames = c("probe", "sample"))

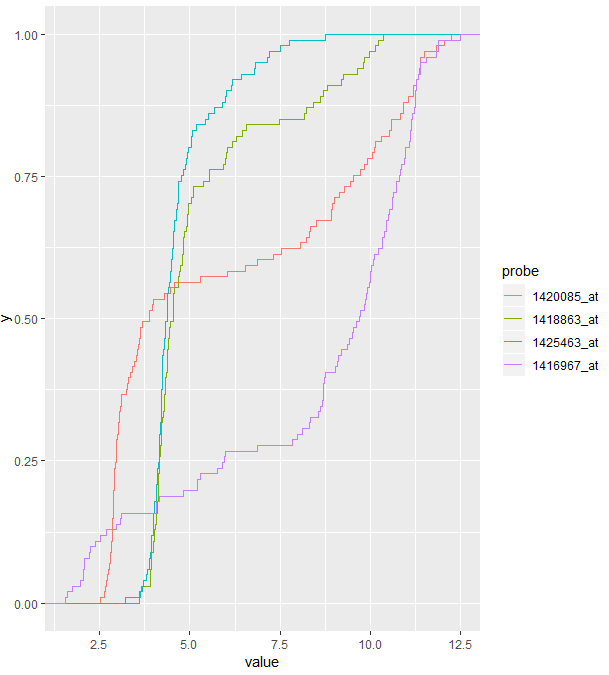
ggplot(genes, aes( x = value, color = probe)) + stat_ecdf() +
  theme(text = element_text(family = "Times"))
3.13 Genomic data
library("ggbio")
data("hg19IdeogramCyto", package = "biovizBase")
plotIdeogram(hg19IdeogramCyto, subchr = "chr1")

> hg19IdeogramCyto
GRanges object with 862 ranges and 2 metadata columns:
        seqnames            ranges strand |     name gieStain
                       |
    [1]     chr1         0-2300000      * |   p36.33     gneg
    [2]     chr1   2300000-5400000      * |   p36.32   gpos25
    [3]     chr1   5400000-7200000      * |   p36.31     gneg
    [4]     chr1   7200000-9200000      * |   p36.23   gpos25
    [5]     chr1  9200000-12700000      * |   p36.22     gneg
    ...      ...               ...    ... .      ...      ...
  [858]     chrY 15100000-19800000      * |  q11.221   gpos50
  [859]     chrY 19800000-22100000      * |  q11.222     gneg
  [860]     chrY 22100000-26200000      * |  q11.223   gpos50
  [861]     chrY 26200000-28800000      * |   q11.23     gneg
  [862]     chrY 28800000-59373566      * |      q12     gvar
  -------
  seqinfo: 24 sequences from an unspecified genome; no seqlengths
- The
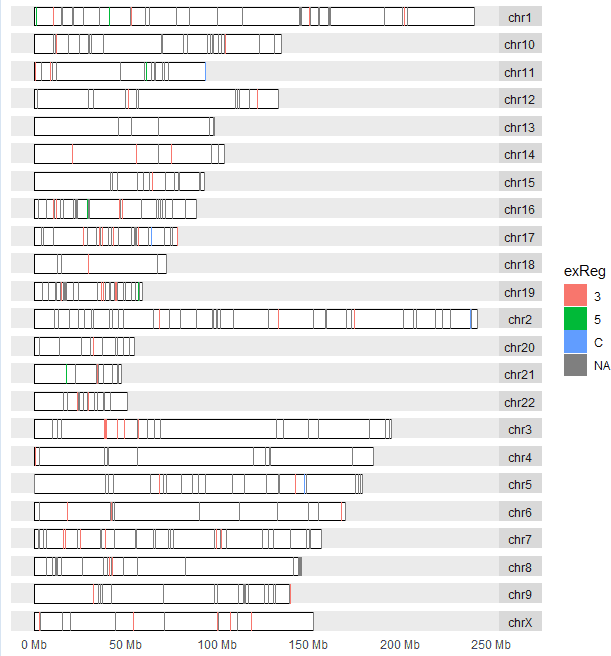
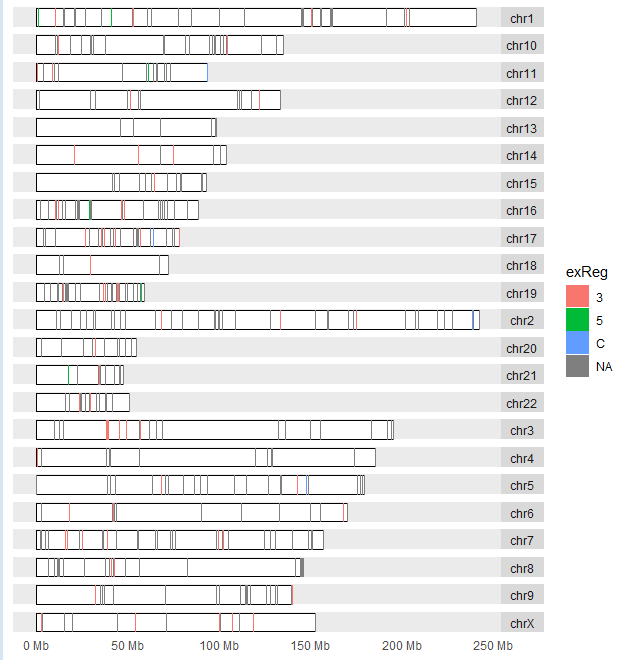
darned_hg19_subset500lists a selection of 500 RNA editing sites in the human genome. It was obtained from the Database of RNA editing in Flies, Mice and Humans(DARNED, http://darned.ucc.ie). The result is shown in Figure 3.46.
library("GenomicRanges")
data("darned_hg19_subset500", package = "biovizBase")
autoplot(darned_hg19_subset500, layout = "karyogram",
         aes(color = exReg, fill = exReg))

> darned_hg19_subset500
GRanges object with 500 ranges and 10 metadata columns:
        seqnames    ranges strand |       inchr       inrna         snp        gene      seqReg       exReg                  source
               |
    [1]     chr5  86618225      - |           A           I                           O                        amygdala
    [2]     chr7  99792382      - |           A           I                           O
    [3]    chr12 110929076      - |           A           I                           O                  salivary gland
    [4]    chr20  25818128      - |           A           I                           O              brain, hippocampus
    [5]     chr3 132397992      + |           A           I                           O                 small intestine
    ...      ...       ...    ... .         ...         ...         ...         ...         ...         ...                     ...
  [496]     chr9 115193271      + |           A           I               HSDL2           I                      cerebellum
  [497]     chr8 145628605      - |           A           I               CPSF1           I         blood, adult leukocytes
  [498]    chr11  12501615      + |           A           I               PARVA           I                   mammary gland
  [499]    chr19  14845136      - |           A           I                EMR2           E           3
  [500]     chr1  84980542      - |           A           I                           O                           liver
             ests      esta            author

    [1]         0         0          15342557
    [2]         0         0          15342557
    [3]         0         0          15342557
    [4]         0         0          15342557
    [5]         0         0          15342557
    ...       ...       ...               ...
  [496]         0         0          15342557
  [497]         0         0 15258596:15342557
  [498]         0         0 15258596:15342557
  [499]         0         0          15258596
  [500]         0         0          15342557
  -------
  seqinfo: 23 sequences from an unspecified genome; no seqlengths

