.NET Memory Allocation Profiling with Visual Studio 2012
.NET Memory Allocation Profiling with Visual Studio 2012
This post was written by Stephen Toub, a frequent contributor to the Parallel Programming in .NET blog. He shows us how Visual Studio 2012 and an attention to detail can help you discover unnecessary allocations in your app that can prevent it from achieving higher performance.
Visual Studio 2012 has a wealth of valuable functionality, so much so that I periodically hear developers that already use Visual Studio asking for a feature the IDE already has and that they’ve just never discovered. Other times, I hear developers asking about a specific feature, thinking it’s meant for one purpose, not realizing it’s really intended for another.
Both of these cases apply to Visual Studio’s .NET memory allocation profiler. Many developers that could benefit from it don’t know it exists, and other developers have an incorrect expectation for its purpose. This is unfortunate, as the feature can provide a lot of value for particular scenarios; many developers will benefit from understanding first that it exists, and second the intended scenarios for its use.
Why memory profiling?
When it comes to .NET and memory analysis, there are two primary reasons one would want to use a diagnostics tool:
- To discover memory leaks. Leaks on a garbage-collecting runtime like the CLR manifest differently than do leaks in a non-garbage-collected environment, such as in code written in C/C++. A leak in the latter typically occurs due to the developer not manually freeing some memory that was previously allocated. In a garbage collected environment, however, manually freeing memory isn’t required, as that’s the duty of the garbage collector (GC). However, the GC can only release memory that is provably no longer being used, meaning as long as there are no rooted references to the memory. Leaks in .NET code manifest then when some memory that should have been collected is incorrectly still rooted, e.g. a reference to the object occurs in an event handler registered with a static event. A good memory analysis tool might help you to find such leaks, such as by allowing you to take snapshots of the process at two different points and then comparing those snapshots to see which objects stuck around for the second point, and more importantly, why.
- To discover unnecessary allocations. In .NET, allocation is often quite cheap. This cost is deceptive, however, as there are more costs later when the GC needs to clean up. The more memory that gets allocated, the more frequently the GC will need to run, and typically the more objects that survive collections, the more work the GC needs to do when it runs to determine which objects are no longer reachable. Thus, the more allocations a program does, the higher the GC costs will be. These GC costs are often negligible to the program’s performance profile, but for certain kinds of apps, especially those on servers that require high-throughput operation, these costs can add up quickly and make a noticeable impact to the performance of the app. As such, a good memory analysis tool might help you to understand all of the allocation being done by the program, in order to help spot allocations you can potentially avoid.
The .NET memory profiler included in Visual Studio 2012 (Professional and higher versions) was designed primarily to address the latter case of helping to discover unnecessary allocations, and it’s quite useful towards that goal, as the rest of this post will explore. The tool is not tuned for the former case of finding and fixing memory leaks, though this is an area the Visual Studio diagnostics team is looking to address in depth for the future (you can see such an experience for JavaScript that was added to Visual Studio as part of VS2012.1). While the tool today does have an advanced option to track when objects are collected, it doesn’t help you to understand why objects weren’t collected or why they were held onto longer than was expected.
There are also other useful tools in this space. The downloadable PerfView tool doesn’t provide as user-friendly an interface as does the .NET memory profiler in Visual Studio 2012, but it is a very powerful tool that supports both tasks of finding memory leaks and discovering unnecessary allocations. It also supports profiling Windows Store apps, which the .NET memory allocation profiler in Visual Studio 2012 does not currently support as of the writing of this post.
Example to be optimized
To better understand the memory profiler’s role and how it can help, let’s walk through an example. We’ll start with the core method that we’ll be looking to optimize (in a real-world case, you’d likely be analyzing your whole application and narrowing in on the particular offending areas, but for the purpose of this example, we’ll keep this constrained):
public static async Task<T> WithCancellation1<T>(this Task<T> task, CancellationToken cancellationToken) { var tcs = new TaskCompletionSource<bool>(); using (cancellationToken.Register(() => tcs.TrySetResult(true))) if (task != await Task.WhenAny(task, tcs.Task)) throw new OperationCanceledException(cancellationToken); return await task; }
The purpose of this small method is to enable code to await a task in a cancelable manner, meaning that regardless of whether the task has completed, the developer wants to be able to stop waiting for it. Instead of writing code like:
T result = await someTask;
the developer would write:
T result = await someTask.WithCancellation1(token);
and if cancellation is requested on the relevant CancellationToken before the task completes, an OperationCanceledException will be thrown. This is achieved in WithCancellation1 by wrapping the original task in an async method. The method creates a second task that will complete when cancellation is requested (by Registering a call to TrySetResult with the CancellationToken), and then uses Task.WhenAny to wait for either the original task or the cancellation task to complete. As soon as either does, the async method completes, either by throwing a cancellation exception if the cancellation task completed first, or by propagating the outcome of the original task by awaiting it. (For more details, see the blog post “How do I cancel non-cancelable async operations?”)
To understand the allocations involved in this method, we’ll use a small harness method:
using System;

using System.Threading; using System.Threading.Tasks; class Harness { static void Main() { Console.ReadLine(); // wait until profiler attaches TestAsync().Wait(); } static async Task TestAsync() { var token = CancellationToken.None; for(int i=0; i<100000; i++) await Task.FromResult(42).WithCancellation1(token); } } static class Extensions { public static async Task<T> WithCancellation1<T>( this Task<T> task, CancellationToken cancellationToken) { var tcs = new TaskCompletionSource<bool>(); using (cancellationToken.Register(() => tcs.TrySetResult(true))) if (task != await Task.WhenAny(task, tcs.Task)) throw new OperationCanceledException(cancellationToken); return await task; } }
The TestAsync method will iterate 100,000 times. Each time, it creates a new task, invokes the WithCancellation1 on it, and awaits the result of that WithCancellation1 call. This await will complete synchronously, as the task created by Task.FromResult is returned in an already completed state, and the WithCancellation1 method itself doesn’t introduce any additional asynchrony such that the task it returns will complete synchronously as well.
Running the .NET memory allocation profiler
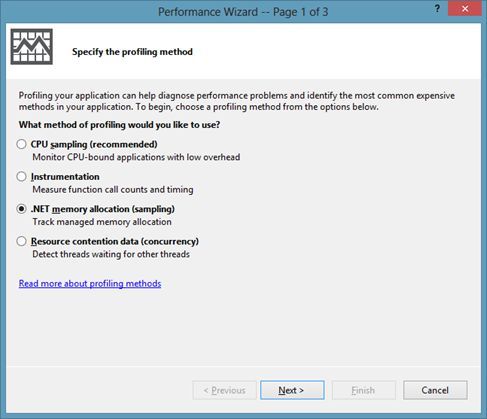
To start the memory allocation profiler, in Visual Studio go to the Analyze menu and select “Launch Performance Wizard…”. This will open a dialog like the following:

Choose “.NET memory allocation (sampling)”, click Next twice, followed by Finish (if this is the first time you’ve used the profiler since you logged into Windows, you’ll need to accept the elevation prompt so the profiler can start). At that point, the application will be launched and the profiler will start monitoring it for allocations (the harness code above also requires that you press ‘Enter’, in order to ensure the profiler has attached by the time the program starts the real test). When the app completes, or when you manually choose to stop profiling, the profiler will load symbols and will start analyzing the trace. That’s a good time to go and get yourself a cup of coffee, or lunch, as depending on how many allocations occurred, the tool can take a while to do this analysis.
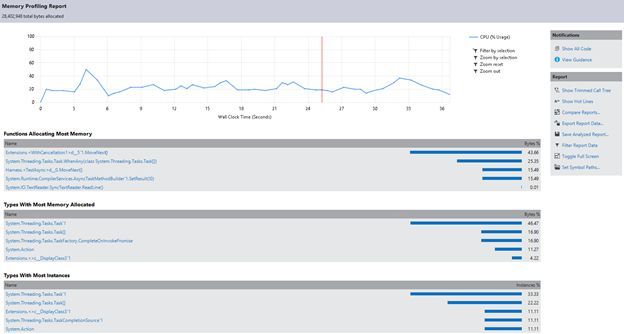
When the analysis completes, we’re presented with a summary of the allocations that occurred, including highlighting the functions that allocated the most memory, the types that resulted in the most memory allocated, and the types with the most instances allocated:

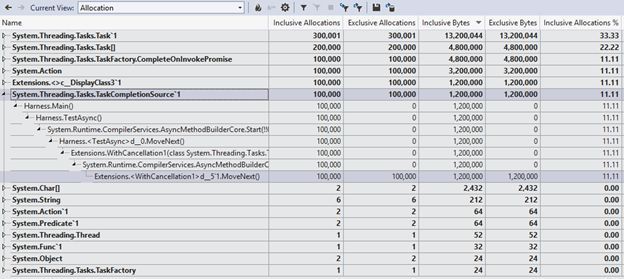
From there, we can drill in further, by looking at the allocations summary (choose “Allocation” from the “Current View” dropdown):

Here, we get to see a row for each type that was allocated, with the columns showing information about how many allocations were tracked, how much space was associated with those allocations, and what percentage of allocations mapped back to that type. We can also expand an entry to see the stack of method calls that resulted in these allocations:

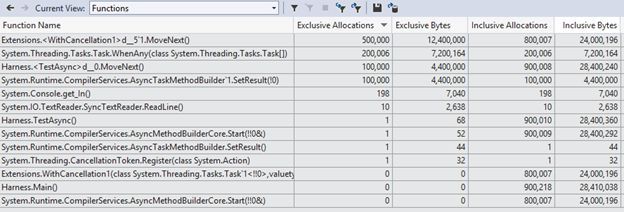
By selecting the “Functions” view, we can get a different pivot on this data, highlighting which functions allocated the most objects and bytes:

Interpreting and acting on the profiling results
With this capability, we can analyze our example’s results. First, we can see that there’s a substantial number of allocations here, which might be surprising. After all, in our example we were using WithCancellation1 with a task that was already completed, which means there should have been very little work to do (with the task already done, there is nothing to cancel), and yet from the above trace we can see that each iteration of our example is resulting in:
- Three allocations of Task`1 (we ran the harness 100K times and can see there were ~300K allocations)
- Two allocations of Task[]
- One allocation each of TaskCompletionSource`1, Action, a compiler-generated type called <>c_DisplayClass2`1, and some type called CompleteOnInvokePromise
That’s nine allocations for a case where we might expect only one (the task allocation we explicitly asked for in the harness by calling Task.FromResult), with our WithCancellation1 method incurring eight allocations.
For helper operations on tasks, it’s actually fairly common to deal with already completed tasks, as often times operations implemented to be asynchronous will actually complete synchronously (e.g. one read operation on a network stream may buffer into memory enough additional data to fulfill a subsequent read operation). As such, optimizing for the already completed case can be really beneficial for performance. Let’s try. Here’s a second attempt at WithCancellation, one that optimizes for several “already completed” cases:
    public static Task<T> WithCancellation2<T>(this Task<T> task,
 CancellationToken cancellationToken) { if (task.IsCompleted || !cancellationToken.CanBeCanceled) return task; else if (cancellationToken.IsCancellationRequested) return new Task<T>(() => default(T), cancellationToken); else return task.WithCancellation1(cancellationToken); }
This implementation checks:
- First, whether the task is already completed or whether the supplied CancellationToken can’t be canceled; in both of those cases, there’s no additional work needed, as cancellation can’t be applied, and as such we can just return the original task immediately rather than spending any time or memory creating a new one.
- Then whether cancellation has already been requested; if it has, we can allocate a single already-canceled task to be returned, rather than spending the eight allocations we previously paid to invoke our original implementation.
- Finally, if none of these fast paths apply, we fall through to calling the original implementation.
Re-profiling our micro-benchmark while using WithCancellation2 instead of WithCancellation1 provides a much improved outlook (you’ll likely notice that the analysis completes much more quickly than it did before, already a sign that we’ve significantly decreased memory allocation). Now we have just have the primary allocation we expected, the one from Task.FromResult called from our TestAsync method in the harness:

So, we’ve now successfully optimized the case where the task is already completed, where cancellation can’t be requested, or where cancellation has already been requested. What about the case where we do actually need to invoke the more complicated logic? Are there any improvements that can be made there?
Let’s change our benchmark to use a task that’s not already completed by the time we invoke WithCancellation2, and also to use a token that can have cancellation requested. This will ensure we make it to the “slow” path:
    static async Task TestAsync()

    {

        var token = new CancellationTokenSource().Token; for (int i = 0; i < 100000; i++) { var tcs = new TaskCompletionSource<int>(); var t = tcs.Task.WithCancellation2(token); tcs.SetResult(42); await t; } }
Profiling again provides more insight:

On this slow path, there are now 14 total allocations per iteration, including the 2 from our TestAsync harness (the TaskCompletionSource<int> we explicitly create, and the Task<int> it creates). At this point, we can use all of the information provided by the profiling results to understand where the remaining 12 allocations are coming from and to then address them as is relevant and possible. For example, let’s look at two allocations specifically: the <>c__DisplayClass2`1 instance and one of the two Action instances. These two allocations will likely be logical to anyone familiar with how the C# compiler handles closures. Why do we have a closure? Because of this line:
using(cancellationToken.Register(() => tcs.TrySetResult(true)))
The call to Register is closing over the ‘tcs’ variable. But this isn’t strictly necessary: the Register method has another overload which instead of taking an Action takes an Action<object> and the object state to be passed to it. If we instead rewrite this line to use that state-based overload, along with a manually cached delegate, we can avoid the closure and those two allocations:
private static readonly Action<object> s_cancellationRegistration = s => ((TaskCompletionSource<bool>)s).TrySetResult(true); … using(cancellationToken.Register(s_cancellationRegistration, tcs))
Rerunning the profiler confirms those two allocations are no longer occurring:
Start profiling today!
This cycle of profiling, finding and eliminating hotspots, and then going around again is a common approach towards improving the performance of your code, whether using a CPU profiler or a memory profiler. So, if you find yourself in a scenario where you determine that minimizing allocations is important for the performance of your code, give the .NET memory allocation profiler in Visual Studio 2012 a try. Feel free to download the sample project used in this blog post.
For more on profiling, see the blog of the Visual Studio Diagnostics team, and ask them questions in the Visual Studio Diagnostics forum.
Stephen Toub