Python车道线检测模块
代码只是对大佬的代码进行了封装。
模型基本思路:
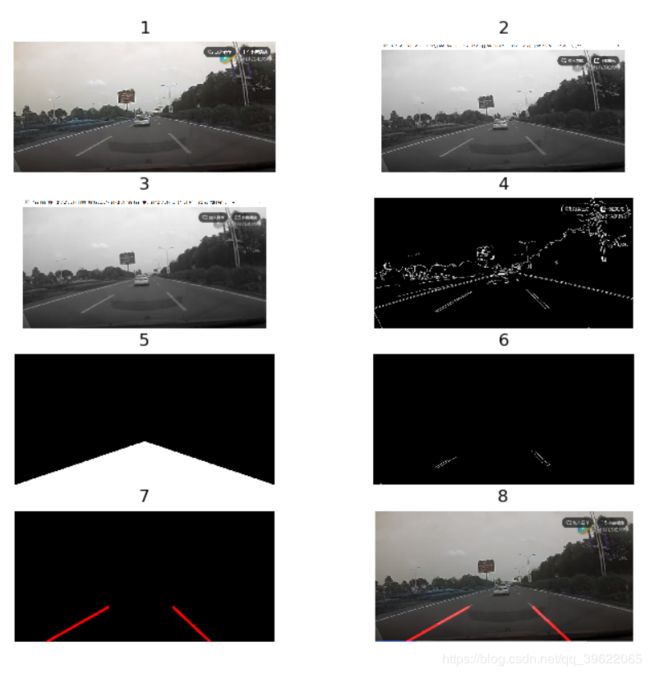
基于Opencv库,采用基本的图形学算法来实现车道线的检测。首先将普通的RGB图片转化为灰度图片,通过高斯滤波器对图片进行平滑去噪,使用Canny边缘检测,指定ROI区域,过滤掉ROI区域以外的图片信息,采用霍夫转换找到车道线。
模型处理流程:
使用说明:
在main方法中给出了接口的使用方法:
 Ld=Lane_Detection()     #实例化对象
 img = cv2.imread('../qwer.jpg') #cv2读入图片
 temp=Ld.predict(img,show_picture=True)
 #使用模型预测车道线,img:图片,show_picture:是否展示图片,return:左右车道的坐标
 print("lane",temp)
模型的局限:
(1)车辆保持在同车道的高速路中行驶;(2)车道线清晰可见;(3)车辆前方一段距离内没有车辆。
注:本模型只是一个基础版本,不适用复杂道路情景。具体商业算法还需对算法进一步优化。
代码部分:
'''
    :Author: "QingTai Jiang"
    :time:"2018/10/5"
    :keyword:"对道路决策算法进行封装"
'''
import numpy as np
import cv2
import matplotlib.pyplot as plt
import warnings
warnings.filterwarnings("ignore")

class Lane_Detection(object):
    def __init__(self):
        self.blur_ksize = 5  # Gaussian blur kernel size
        self.canny_lthreshold = 50  # Canny edge detection low threshold
        self.canny_hthreshold = 150  # Canny edge detection high threshold
        self.rho = 1                # Hough transform parameters
        self.theta = np.pi / 180
        self.threshold = 15
        self.min_line_length = 40
        self.max_line_gap = 20
        self.left_lane_xy=0
        self.right_lane_xy=0
        self.image=0
    def show_image(self,lane_image):  # 展示图片
        print("show image")
        _, (ax1, ax) = plt.subplots(1, 2, figsize=(14, 14))
        ax.set_title('Lane_image')
        ax.axis('off')
        ax1.axis('off')
        ax1.set_title("Base_image")
        ax.imshow(lane_image[:, :, ::-1])
        ax1.imshow(self.image[:, :, ::-1])
        plt.show()

    def roi_mask(self,img, vertices):  # 指定ROI,指定区域
        mask = np.zeros_like(img)  # 全黑图像
        if len(img.shape) > 2:
            channel_count = img.shape[2]  # i.e. 3 or 4 depending on your image
            mask_color = (255,) * channel_count
        else:
            mask_color = 255
        cv2.fillPoly(mask, vertices, mask_color)  # 按照图像位置填充

        masked_img = cv2.bitwise_and(img, mask)  # 按位 与 1 and 1 = 1 ,白色是1  黑色是0
        # 拿到了车道的黑白图像
        return masked_img

    def draw_roi(self,img, vertices):
        cv2.polylines(img, vertices, True, [255, 0, 0], thickness=2)
    def draw_lines(self,img, lines, color=[255, 0, 0], thickness=2):
        for line in lines:
            for x1, y1, x2, y2 in line:
                cv2.line(img, (x1, y1), (x2, y2), color, thickness)

    def hough_lines(self,img, rho, theta, threshold, min_line_len, max_line_gap):
        '''
        image: 必须是二值图像,推荐使用canny边缘检测的结果图像;
        rho: 线段以像素为单位的距离精度,double类型的,推荐用1.0
        theta: 线段以弧度为单位的角度精度,推荐用numpy.pi/180
        threshod: 累加平面的阈值参数,int类型,超过设定阈值才被检测出线段,值越大,基本上意味着检出的线段越长,检出的线段个数越少。根据情况推荐先用100试试
        lines:这个参数的意义未知,发现不同的lines对结果没影响,但是不要忽略了它的存在
        minLineLength:线段以像素为单位的最小长度,根据应用场景设置
        maxLineGap:同一方向上两条线段判定为一条线段的最大允许间隔(断裂),超过了设定值,则把两条线段当成一条线段,值越大,允许线段上的断裂越大,越有可能检出潜在的直线段
        '''
        # 返回直线的数组坐标
        # 霍夫直线检测-HoughLinesP函数参数
        lines = cv2.HoughLinesP(img, rho, theta, threshold, np.array([]), minLineLength=min_line_len,
                                maxLineGap=max_line_gap)
        # print("lines:", lines)
        line_img = np.zeros((img.shape[0], img.shape[1], 3), dtype=np.uint8)
        self.draw_lanes(line_img, lines)

        return line_img

    def draw_lanes(self,img, lines, color=[255, 0, 0], thickness=8):
        '''
        现在我们要根据得到的线计算出左车道和右车道,一种可以采用的步骤是:
        根据斜率正负划分某条线属于左车道或右车道
        分别对左右车道线移除outlier:迭代计算各条线的斜率与斜率均值的差,逐一移除差值过大的线
        分别对左右车道线的顶点集合做linear regression,得到最终车道。
        '''
        # print("lines:", lines)
        left_lines, right_lines = [], []
        for line in lines:
            for x1, y1, x2, y2 in line:
                k = (y2 - y1) / (x2 - x1)
                if k < 0:
                    left_lines.append(line)
                else:
                    right_lines.append(line)
        if (len(left_lines) <= 0 or len(right_lines) <= 0):
            return img
        self.clean_lines(left_lines, 0.1)
        self.clean_lines(right_lines, 0.1)  # 清除异常点
        left_points = [(x1, y1) for line in left_lines for x1, y1, x2, y2 in line]

        left_points = left_points + [(x2, y2) for line in left_lines for x1, y1, x2, y2 in line]

        right_points = [(x1, y1) for line in right_lines for x1, y1, x2, y2 in line]

        right_points = right_points + [(x2, y2) for line in right_lines for x1, y1, x2, y2 in line]

        left_vtx = self.calc_lane_vertices(left_points, 325, img.shape[0])

        right_vtx = self.calc_lane_vertices(right_points, 325, img.shape[0])

        self.left_lane_xy=left_vtx
        self.right_lane_xy=right_vtx

        # 画直线
        cv2.line(img, left_vtx[0], left_vtx[1], color, thickness)
        cv2.line(img, right_vtx[0], right_vtx[1], color, thickness)

    def clean_lines(self,lines, threshold):
        slope = [(y2 - y1) / (x2 - x1) for line in lines for x1, y1, x2, y2 in line]
        while len(lines) > 0:
            mean = np.mean(slope)
            diff = [abs(s - mean) for s in slope]
            idx = np.argmax(diff)
            if diff[idx] > threshold:
                slope.pop(idx)
                lines.pop(idx)
            else:
                break

    def calc_lane_vertices(self,point_list, ymin, ymax):
        x = [p[0] for p in point_list]
        y = [p[1] for p in point_list]
        fit = np.polyfit(y, x, 1)
        fit_fn = np.poly1d(fit)
        xmin = int(fit_fn(ymin))
        xmax = int(fit_fn(ymax))

        return [(xmin, ymin), (xmax, ymax)]

    def predict(self,img,show_picture=True):
        '''
        :param img: 传入CV2读取的图片
        :return:    返回左右车道的坐标
        '''

        self.image=img
        roi_vtx = np.array([[(0, img.shape[0]), ((img.shape[1] * 20) // 40, (img.shape[0] * 2) // 3),
                             ((img.shape[1] * 22) // 44, (img.shape[0] * 2) // 3), (img.shape[1], img.shape[0])]])

        gray = cv2.cvtColor(img, cv2.COLOR_RGB2GRAY)  # 彩色转化为灰度图

        blur_gray = cv2.GaussianBlur(gray, (self.blur_ksize, self.blur_ksize), 0, 0)  # 高斯模糊

        edges = cv2.Canny(blur_gray, self.canny_lthreshold, self.canny_hthreshold)  # 边缘检测

        roi_edges = self.roi_mask(edges, roi_vtx)  # 拿到车道黑白图像

        line_img = self.hough_lines(roi_edges, self.rho, self.theta, self.threshold, self.min_line_length, self.max_line_gap)

        res_img = cv2.addWeighted(img, 0.8, line_img, 1, 0)  # 两个图片叠加显示
        if show_picture:
            print("res_img")
            self.show_image(res_img)

        return self.right_lane_xy,self.left_lane_xy

if __name__=="__main__":
    Ld=Lane_Detection()
    img = cv2.imread('../qwer.jpg')
    temp=Ld.predict(img,show_picture=True)
    print("lane",temp)