close
all
;
clear
all
;
clc
;
%% ----------init-----------------------------
f
=
imread
(
'./original_DIP.tif'
);
f
=
mat2gray
(
f
,[
0
255
]);
f_original
=
f
;
[
M
,
N
]
=
size
(
f
);
P
=
2
*
M
;
Q
=
2
*
N
;
fc
=
zeros
(
M
,
N
);
for
x
=
1
:
1
:
M
for
y
=
1
:
1
:
N
fc
(
x
,
y
)
=
f
(
x
,
y
)
*
(
-
1
)^
(
x
+
y
);
end
end
F_I
=
fft2
(
fc
,
P
,
Q
);
figure
();
subplot
(
1
,
2
,
1
);
imshow
(
f
,[
0
1
]);
xlabel
(
'a).Original Image'
);
subplot
(
1
,
2
,
2
);
imshow
(
log
(
1
+
abs
(
F_I
)),[
]);
xlabel
(
'b).Fourier spectrum of a).'
);
%% ------motion blur------------------
H
=
zeros
(
P
,
Q
);
a
=
0.02
;
b
=
0.02
;
T
=
1
;
for
x
=
(
-
P
/
2
):
1
:(
P
/
2
)
-
1
for
y
=
(
-
Q
/
2
):
1
:(
Q
/
2
)
-
1
R
=
(
x
*
a
+
y
*
b
)
*
pi
;
if
(
R
==
0
)
H
(
x
+
(
P
/
2
)
+
1
,
y
+
(
Q
/
2
)
+
1
)
=
T
;
else
H
(
x
+
(
P
/
2
)
+
1
,
y
+
(
Q
/
2
)
+
1
)
=
(
T
/
R
)
*
(
sin
(
R
))
*
exp
(
-
1
i
*
R
);
end
end
end
%% ------the atmospheric turbulence modle------------------
H_1
=
zeros
(
P
,
Q
);
k
=
0.0025
;
for
x
=
(
-
P
/
2
):
1
:(
P
/
2
)
-
1
for
y
=
(
-
Q
/
2
):
1
:(
Q
/
2
)
-
1
D
=
(
x^
2
+
y^
2
)^
(
5
/
6
);
D_0
=
60
;
H_1
(
x
+
(
P
/
2
)
+
1
,
y
+
(
Q
/
2
)
+
1
)
=
exp
(
-
k
*
D
);
end
end
%% -----------noise------------------
a
=
0
;
b
=
0.2
;
n_gaussian
=
a
+
b
.*
randn
(
M
,
N
);
Noise
=
fft2
(
n_gaussian
,
P
,
Q
);
figure
();
subplot
(
1
,
2
,
1
);
imshow
(
n_gaussian
,[
-
1
1
]);
xlabel
(
'a).Gaussian noise'
);
subplot
(
1
,
2
,
2
);
imshow
(
log
(
1
+
abs
(
Noise
)),[
]);
xlabel
(
'b).Fourier spectrum of a).'
);
%%
G
=
H
.*
F_I
+
Noise
;
% G = H_1 .* F_I + Noise;
gc
=
ifft2
(
G
);
gc
=
gc
(
1
:
1
:
M
+
27
,
1
:
1
:
N
+
27
);
for
x
=
1
:
1
:(
M
+
27
)
for
y
=
1
:
1
:(
N
+
27
)
g
(
x
,
y
)
=
gc
(
x
,
y
)
.*
(
-
1
)^
(
x
+
y
);
end
end
gc
=
gc
(
1
:
1
:
M
,
1
:
1
:
N
);
for
x
=
1
:
1
:(
M
)
for
y
=
1
:
1
:(
N
)
g
(
x
,
y
)
=
gc
(
x
,
y
)
.*
(
-
1
)^
(
x
+
y
);
end
end
figure
();
subplot
(
1
,
2
,
1
);
imshow
(
f
,[
0
1
]);
xlabel
(
'a).Original Image'
);
subplot
(
1
,
2
,
2
);
imshow
(
log
(
1
+
abs
(
F_I
)),[
]);
xlabel
(
'b).Fourier spectrum of a).'
);
figure
();
subplot
(
1
,
2
,
1
);
imshow
(
abs
(
H
),[
]);
xlabel
(
'c).The motion modle H(u,v)(a=0.02,b=0.02,T=1)'
);
subplot
(
1
,
2
,
2
);
n
=
1
:
1
:
P
;
plot
(
n
,
abs
(
H
(
400
,:)));
axis
([
0
P
0
1
]);
grid
;
xlabel
(
'H(n,400)'
);
ylabel
(
'|H(u,v)|'
);
figure
();
subplot
(
1
,
2
,
1
);
imshow
(
real
(
g
),[
0
1
]);
xlabel
(
'd).Result image'
);
subplot
(
1
,
2
,
2
);
imshow
(
log
(
1
+
abs
(
G
)),[
]);
xlabel
(
'e).Fourier spectrum of d). '
);
%% --------------inverse_filtering---------------------
%F = G ./ H;
%F = G ./ H_1;
for
x
=
(
-
P
/
2
):
1
:(
P
/
2
)
-
1
for
y
=
(
-
Q
/
2
):
1
:(
Q
/
2
)
-
1
D
=
(
x^
2
+
y^
2
)^
(
0.5
);
if
(
D
<
258
)
F
(
x
+
(
P
/
2
)
+
1
,
y
+
(
Q
/
2
)
+
1
)
=
G
(
x
+
(
P
/
2
)
+
1
,
y
+
(
Q
/
2
)
+
1
)
./
H_1
(
x
+
(
P
/
2
)
+
1
,
y
+
(
Q
/
2
)
+
1
);
% no noise D < 188
% noise D < 56
else
F
(
x
+
(
P
/
2
)
+
1
,
y
+
(
Q
/
2
)
+
1
)
=
G
(
x
+
(
P
/
2
)
+
1
,
y
+
(
Q
/
2
)
+
1
);
end
end
end
% Butterworth_Lowpass_Filters
H_B
=
zeros
(
P
,
Q
);
D_0
=
70
;
for
x
=
(
-
P
/
2
):
1
:(
P
/
2
)
-
1
for
y
=
(
-
Q
/
2
):
1
:(
Q
/
2
)
-
1
D
=
(
x^
2
+
y^
2
)^
(
0.5
);
%if(D < 200) H_B(x+(P/2)+1,y+(Q/2)+1) = 1/(1+(D/D_0)^100);end
H_B
(
x
+
(
P
/
2
)
+
1
,
y
+
(
Q
/
2
)
+
1
)
=
1
/
(
1
+
(
D
/
D_0
)^
20
);
end
end
F
=
F
.*
H_B
;
f
=
real
(
ifft2
(
F
));
f
=
f
(
1
:
1
:
M
,
1
:
1
:
N
);
for
x
=
1
:
1
:(
M
)
for
y
=
1
:
1
:(
N
)
f
(
x
,
y
)
=
f
(
x
,
y
)
*
(
-
1
)^
(
x
+
y
);
end
end
%% ------show Result------------------
figure
();
subplot
(
1
,
2
,
1
);
imshow
(
f
,[
0
1
]);
xlabel
(
'a).Result image'
);
subplot
(
1
,
2
,
2
);
imshow
(
log
(
1
+
abs
(
F
)),[
]);
xlabel
(
'b).Fourier spectrum of a).'
);
figure
();
n
=
1
:
1
:
P
;
plot
(
n
,
abs
(
F
(
400
,:)),
'r-'
,
n
,
abs
(
F
(
400
,:)),
'b-'
);
axis
([
0
P
0
1000
]);
grid
;
xlabel
(
'Number of rows(400th column)'
);
ylabel
(
'Fourier amplitude spectrum'
);
legend
(
'F_{limit}(u,v)'
,
'F(u,v)'
);
figure
();
n
=
1
:
1
:
P
;
plot
(
n
,
abs
(
H
(
400
,:)),
'g-'
);
axis
([
0
P
0
1
]);
grid
;
xlabel
(
'H''_{s}(n,400)'
);
ylabel
(
'|H''_{s}(u,v)|'
);
%% ----------Wiener filters-----------
% K = 0.000014;
K
=
0.02
;
%H_Wiener = ((abs(H_1).^2)./((abs(H_1).^2)+K)).*(1./H_1);
H_Wiener
=
((
abs
(
H
)
.^
2
)
./
((
abs
(
H
)
.^
2
)
+
K
))
.*
(
1.
/
H
);
F_Wiener
=
H_Wiener
.*
G
;
f_Wiener
=
real
(
ifft2
(
F_Wiener
));
f_Wiener
=
f_Wiener
(
1
:
1
:
M
,
1
:
1
:
N
);
for
x
=
1
:
1
:(
M
)
for
y
=
1
:
1
:(
N
)
f_Wiener
(
x
,
y
)
=
f_Wiener
(
x
,
y
)
*
(
-
1
)^
(
x
+
y
);
end
end
[
SSIM_Wiener
mssim
]
=
ssim_index
(
f_Wiener
,
f_original
,[
0.01
0.03
],
ones
(
8
),
1
);
SSIM_Wiener
%% ------show Result------------------
figure
();
subplot
(
1
,
2
,
1
);
%imshow(f_Wiener(1:128,1:128),[0 1]);
imshow
(
f_Wiener
,[
0
1
]);
xlabel
(
'd).Result image by Wiener filter'
);
subplot
(
1
,
2
,
2
);
imshow
(
log
(
1
+
abs
(
F_Wiener
)),[
]);
xlabel
(
'c).Fourier spectrum of c).'
);
% subplot(1,2,2);
% %imshow(f(1:128,1:128),[0 1]);
% imshow(f,[0 1]);
% xlabel('e).Result image by inverse filter');
figure
();
n
=
1
:
1
:
P
;
plot
(
n
,
abs
(
F
(
400
,:)),
'r-'
,
n
,
abs
(
F_Wiener
(
400
,:)),
'b-'
);
axis
([
0
P
0
500
]);
grid
;
xlabel
(
'Number of rows(400th column)'
);
ylabel
(
'Fourier amplitude spectrum'
);
legend
(
'F(u,v)'
,
'F_{Wiener}(u,v)'
);
figure
();
subplot
(
1
,
2
,
1
);
imshow
(
log
(
1
+
abs
(
H_Wiener
)),[
]);
xlabel
(
'a).F_{Wiener}(u,v).'
);
subplot
(
1
,
2
,
2
);
n
=
1
:
1
:
P
;
plot
(
n
,
abs
(
H_Wiener
(
400
,:)));
axis
([
0
P
0
80
]);
grid
;
xlabel
(
'Number of rows(400th column)'
);
ylabel
(
'Amplitude spectrum'
);
%% ------------Constrained_least_squares_filtering---------
p_laplacian
=
zeros
(
M
,
N
);
Laplacian
=
[
0
-
1
0
;
-
1
4
-
1
;
0
-
1
0
];
p_laplacian
(
1
:
3
,
1
:
3
)
=
Laplacian
;
P
=
2
*
M
;
Q
=
2
*
N
;
for
x
=
1
:
1
:
M
for
y
=
1
:
1
:
N
p_laplacian
(
x
,
y
)
=
p_laplacian
(
x
,
y
)
*
(
-
1
)^
(
x
+
y
);
end
end
P_laplacian
=
fft2
(
p_laplacian
,
P
,
Q
);
F_C
=
zeros
(
P
,
Q
);
r
=
0.2
;
H_clsf
=
((
H
'
)
./
((
abs
(
H
)
.^
2
)
+
r
.*
P_laplacian
));
F_C
=
H_clsf
.*
G
;
f_c
=
real
(
ifft2
(
F_C
));
f_c
=
f_c
(
1
:
1
:
M
,
1
:
1
:
N
);
for
x
=
1
:
1
:(
M
)
for
y
=
1
:
1
:(
N
)
f_c
(
x
,
y
)
=
f_c
(
x
,
y
)
*
(
-
1
)^
(
x
+
y
);
end
end
%%
figure
();
subplot
(
1
,
2
,
1
);
imshow
(
f_c
,[
0
1
]);
xlabel
(
'e).Result image by constrained least squares filter (r = 0.2)'
);
subplot
(
1
,
2
,
2
);
imshow
(
log
(
1
+
abs
(
F_C
)),[
]);
xlabel
(
'f).Fourier spectrum of c).'
);
[
SSIM_CLSF
mssim
]
=
ssim_index
(
f_c
,
f_original
,[
0.01
0.03
],
ones
(
8
),
1
);
figure
();
subplot
(
1
,
2
,
1
);
imshow
(
log
(
1
+
abs
(
H_clsf
)),[
]);
xlabel
(
'a).F_{clsf}(u,v).'
);
subplot
(
1
,
2
,
2
);
n
=
1
:
1
:
P
;
plot
(
n
,
abs
(
H_clsf
(
400
,:)));
axis
([
0
P
0
80
]);
grid
;
xlabel
(
'Number of rows(400th column)'
);
ylabel
(
'Amplitude spectrum'
);
 的去除。本博文,主要介绍图像的逆滤波,即退化函数
 的去除。然而,逆滤波在空间域内的处理是很不方便的。
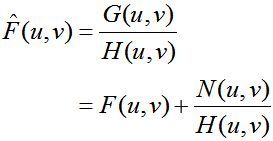
 去除的过程。这样看来的话,直接做除法就可以了,如下所示。
 。其次,如果退化函数
 含有0值或者极小值的话,会使得噪声项
 变得极大。
变得极大。
 的推测。
的推测。
 影响画质。
影响画质。
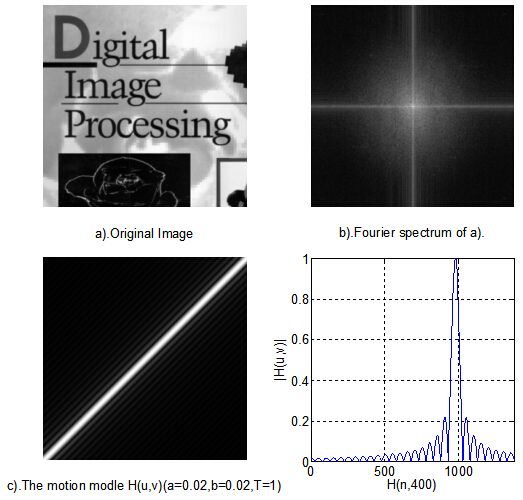
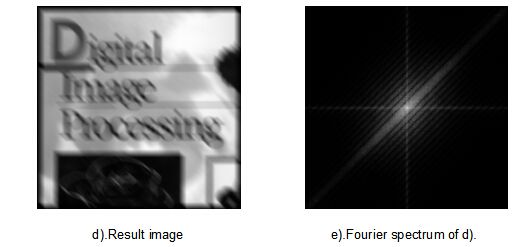
 值的增大,得到的图像越来越模糊。以下是这个模型执行的结果。
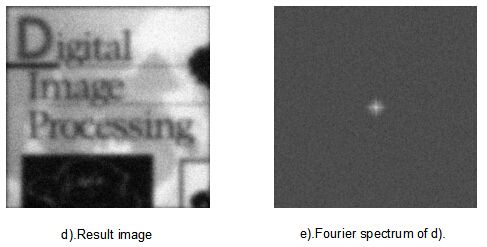
 处理图像,然后加上适当的可加性噪声
 。使用这样的图像进行逆滤波实验。
 ,有如下两个结论。

