「二分类算法」提供银行精准营销解决方案(样本不平衡问题)
项目背景
项目来源于Kesci平台:提供银行精准营销解决方案
项目简介
本练习赛的数据,选自UCI机器学习库中的「银行营销数据集(Bank Marketing Data Set)」
这些数据与葡萄牙银行机构的营销活动相关。这些营销活动以电话为基础,一般,银行的客服人员需要联系客户至少一次,以此确认客户是否将认购该银行的产品(定期存款)。
因此,与该数据集对应的任务是「分类任务」,「分类目标」是预测客户是(’ 1 ‘)或者否(’ 0 ')购买该银行的产品。
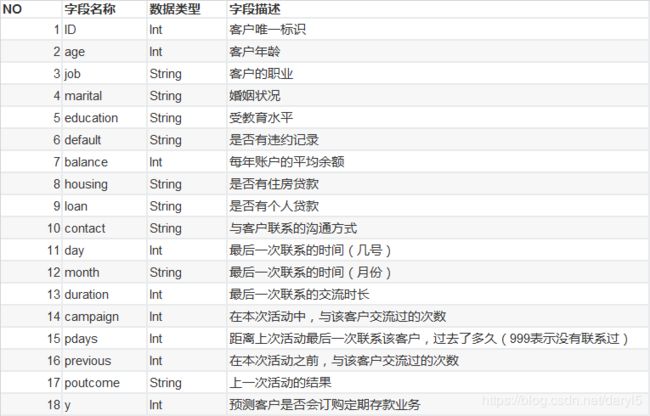
数据字段说明

本次测评算法为: AUC(Area Under the Curve)
本项目的数据集比较简单,不用过多的预处理。因样本存在严重的不平衡问题,本文借此探索在样本不平衡情况下的一些简单处理方案。
数据导入及探索
import numpy as np
import pandas as pd
import matplotlib.pyplot as plt
import seaborn as sns
%matplotlib inline

train=pd.read_csv(r'E:\date\kesci\train_set.csv')
test=pd.read_csv(r'E:\date\kesci\test_set.csv')

train.shape
#out:(25317, 18)
test.shape
#out:(10852, 17)

train.isnull().sum()  #不存在缺失值
train.duplicated().sum()  #不存在重复值

train.describe()  #无异常值

train['y'].value_counts()[1]/train['y'].value_counts().sum()
#out:0.11695698542481336
#样本存在严重的不均衡问题,正样本数只占11.7%
由上述探索可发现,数据集比较规范,就是样本不平衡问题比较严重。
数据预处理
从上述探索数据的过程中发行,特征中有连续型数值特征,二值型描述特征,离散型特征。
下面需要对不同特征进行分别处理:
连续型数值特征:数据标准化(下面建模要用到逻辑回归)
二值型描述特征:二值化
离散型特征:one-hot编码
#需要进行数据无量纲化处理的列
standard_scaler_list=['age','balance','duration','campaign','pdays','previous']
#需要转换为0-1二值编码的列
set_01_list=['default','housing','loan']
#需要进行one-hot编码的列
one_hot_list=['job','marital','education','contact','day','month','poutcome']

#1.0-1编码
#训练集
from sklearn.preprocessing import OrdinalEncoder
train_done=train.copy()
encoder=OrdinalEncoder()
encoder.fit(train_done.loc[:,set_01_list])
train_done.loc[:,set_01_list]=encoder.transform(train_done.loc[:,set_01_list])
#测试集
test_done=test.copy()
test_done.loc[:,set_01_list]=encoder.transform(test_done.loc[:,set_01_list])

#2.one-hot编码
#训练集
train_onehot=train[one_hot_list]
for i in one_hot_list:
    a=pd.get_dummies(train_onehot[i],columns=[i],prefix=i)
    train_done=pd.concat([train_done,a],axis=1)

train_done.drop(one_hot_list,axis=1,inplace=True)
#测试集
test_onehot=test[one_hot_list]
for i in one_hot_list:
    a=pd.get_dummies(test_onehot[i],columns=[i],prefix=i)
    test_done=pd.concat([test_done,a],axis=1)
test_done.drop(one_hot_list,axis=1,inplace=True)

#3.数据无量纲化
#训练集
from sklearn.preprocessing import StandardScaler
scaler=StandardScaler()
scaler.fit(train_done.loc[:,standard_scaler_list])
train_done.loc[:,standard_scaler_list]=scaler.transform(train_done.loc[:,standard_scaler_list])

#测试集
test_done.loc[:,standard_scaler_list]=scaler.transform(test_done.loc[:,standard_scaler_list])
构建训练数据集
#构建训练集
X=train_done.drop(['ID','y'],axis=1)
y=train_done['y']
#测试集处理
test_x=test_done.drop('ID',axis=1)
test_id=test_done['ID']
模型构建
下面测试逻辑回归和随机森林两个模型
样品不平衡处理方式:
1.样品不平衡下可用的一些评价指标:混淆矩阵;精准率;召回率;ROC曲线;AUC等;
2.过采样法。
本文的背景是营销人员通过电话联系客户推广银行的定期存款产品,电话沟通的成本相对来说并不是太高。所以我们希望能够尽量多的识别出会购买产品的客户,也就是召回率尽可能高。当然召回率的提高,会造成精准率下降,会打扰到更多的不会购买产品的客户,使客户感到厌烦。同时也会给银行带来人力成本、营销费用的增高。故我们希望最终在召回率比较高的情况下考虑一个平衡。
建模时我们以AUC面积作为评分标准,或者过采样平衡样本后,以准确率评价模型。
一、逻辑回归
模型构建
#逻辑回归
from sklearn.linear_model import LogisticRegression as LR
from sklearn.model_selection import cross_val_score
from sklearn.model_selection import train_test_split
from sklearn.metrics import accuracy_score,confusion_matrix as cm,precision_score,recall_score,roc_curve,roc_auc_score as AUC

#拆分数据集,构建训练、测试数据集
Xtrain,Xtest,Ytrain,Ytest=train_test_split(X,y,test_size=0.3,random_state=420)

#调参C
score=[]
C=np.arange(0.01,10.01,0.5)
for i in C:
    lr=LR(solver='liblinear',C=i,random_state=420)
    score.append(cross_val_score(lr,Xtrain,Ytrain,cv=10,scoring='roc_auc').mean())
print(max(score),C[score.index(max(score))])
plt.figure(figsize=(20,5))
plt.plot(C,score)
plt.xticks(C)
plt.legend()
plt.show()
#可以继续细化调参范围,我这边获得的最佳参数C=0.11

#训练数据
lr=LR(solver='liblinear',C=0.11,random_state=420)
lr=lr.fit(Xtrain,Ytrain)
#模型跑出的训练数据结果
Ytrain_pred=lr.predict(Xtrain)
#模型跑出的测试数据结果
Ytest_pred=lr.predict(Xtest)
结果分析
#混淆矩阵
cm(Ytrain,Ytrain_pred,labels=[1,0])
'''
array([[  741,  1340],
       [  342, 15298]], dtype=int64)
'''
#从上面结果可以看出,训练数据集中正样本大部分都被分错了
cm(Ytest,Ytest_pred,labels=[1,0])
'''
array([[ 317,  563],
       [ 174, 6542]], dtype=int64)
'''
#测试数据集也是这样

#AUC面积
AUC(Ytrain,lr.predict_proba(Xtrain)[:,1])
'''
0.9141338145270016
'''
AUC(Ytest,lr.predict_proba(Xtest)[:,1])
'''
0.9032848963127402
'''
#AUC面积看起来还挺高,只能说负样本占比太大了。
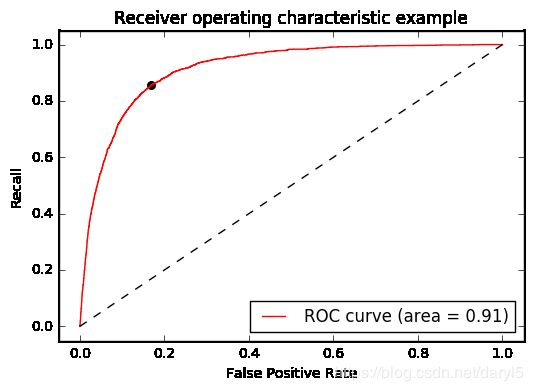
ROC曲线
上面逻辑回归也没有什么参数可以调节了,下面我们画ROC曲线来看下:
#画roc-auc曲线
def get_rocauc(X,y,clf):
    from sklearn.metrics import roc_curve
    FPR,recall,thresholds=roc_curve(y,clf.predict_proba(X)[:,1],pos_label=1)
    area=AUC(y,clf.predict_proba(X)[:,1])

    maxindex=(recall-FPR).tolist().index(max(recall-FPR))
    threshold=thresholds[maxindex]

    plt.figure()
    plt.plot(FPR,recall,color='red',label='ROC curve (area = %0.2f)'%area)
    plt.plot([0,1],[0,1],color='black',linestyle='--')
    plt.scatter(FPR[maxindex],recall[maxindex],c='black',s=30)
    plt.xlim([-0.05,1.05])
    plt.ylim([-0.05,1.05])
    plt.xlabel('False Positive Rate')
    plt.ylabel('Recall')
    plt.title('Receiver operating characteristic example')
    plt.legend(loc='lower right')
    plt.show()
    return threshold
threshold=get_rocauc(Xtrain,Ytrain,lr)
'''
0.11465704617442256
'''

图中左上角的点即是Recall和FPR平衡的点,threshold即为平衡点对应的阀值。
我们可以根据阀值重新来构建预测结果:
def get_ypred(X,clf,threshold):
    y_pred=[]
    for i in clf.predict_proba(X)[:,1]:
        if i > threshold:
            y_pred.append(1)
        else:
            y_pred.append(0)
    return y_pred
ytrain_pred=get_ypred(Xtrain,lr,threshold)
#混淆矩阵
cm(Ytrain,ytrain_pred,labels=[1,0])
'''
array([[ 1783,   298],
       [ 2651, 12989]], dtype=int64)
'''
#识别出了更多的正类

#精准率低了很多,但是recall比例有更大的提升
precision_score(Ytrain,ytrain_pred)
'''
0.40211998195760035
'''

recall_score(Ytrain,ytrain_pred)
'''
0.8567996155694377
'''
#测试集上的recall表现也不错
cm(Ytest,get_ypred(Xtest,lr,threshold),labels=[1,0])
'''
array([[ 727,  153],
       [1189, 5527]], dtype=int64)
'''
过采样
#上采样法平衡样本
import imblearn
from imblearn.over_sampling import SMOTE
sm=SMOTE(random_state=420)
Xtrain_,Ytrain_=sm.fit_sample(Xtrain,Ytrain)

#建模
lr_=LR(solver='liblinear',random_state=420)
auc_score_=cross_val_score(lr_,Xtrain_,Ytrain_,cv=10).mean()
'''
0.8543797953964194
'''

#调参C,因为现在加了很多手工数据,样品是平衡的,这里就用默认的准确率作为模型评分
score=[]
C=np.arange(0.01,10.01,0.5)
for i in C:
    lr_=LR(solver='liblinear',C=i,random_state=420)
    score.append(cross_val_score(lr_,Xtrain_,Ytrain_,cv=10).mean())
print(max(score),C[score.index(max(score))])
plt.figure(figsize=(20,5))
plt.plot(C,score)
plt.xticks(C)
plt.legend()
plt.show()
#可以继续细化,最优参数C=3.01

#建模
lr_=LR(solver='liblinear',C=3.01,random_state=420)
#训练
lr_=lr_.fit(Xtrain_,Ytrain_)
Ypred_train_=lr_.predict(Xtrain_)
Ypred_test_=lr_.predict(Xtest)
#混淆矩阵
cm(Ytrain_,Ypred_train_,labels=[1,0])
'''
array([[13406,  2234],
       [ 2289, 13351]], dtype=int64)
'''
#混淆矩阵-测试集
cm(Ytest,Ypred_test_,labels=[1,0])
'''
array([[ 703,  177],
       [1018, 5698]], dtype=int64)
'''
#AUC面积
AUC(Ytrain_,lr_.predict_proba(Xtrain_)[:,1])
'''
0.9246362816504339
'''
AUC(Ytest,lr_.predict_proba(Xtest)[:,1])
'''
0.9031982646597
'''
#可以看到过采样法跟之前用roc_auc作为评分结果都差不多,都可以处理样本不平衡问题。
提交结果
lr=LR(solver='liblinear',C=0.11,random_state=420)
lr=lr.fit(X,y)
ytest_pred2=lr.predict_proba(test_x)[:,1]
result2=pd.DataFrame({'ID':test_id,'pred':ytest_pred2})
result2.to_csv(r'E:\date\kesci\result_lr.csv',index=False)
这个结果提交到网站上的得分是:0.9059203033246392。
二、随机森林
from sklearn.ensemble import RandomForestClassifier
rfc=RandomForestClassifier(random_state=0)

#调参
score1=[]
param=np.arange(1,1000,100)
for i in param:
    rfc=RandomForestClassifier(n_estimators=i,n_jobs=-1,random_state=90)
    score=cross_val_score(rfc,df_Xtrain,df_Ytrain,cv=10,scoring='roc_auc').mean()
    score1.append(score)
print(max(score1),param[(score1.index(max(score1)))])
plt.figure(figsize=[20,5])
plt.plot(param,score1,'o-')
plt.show()
#可以继续细化,最优参数:n_estimators=960

#调参max_depth
score1=[]
param=np.arange(1,20,1)
for i in param:
    rfc=RandomForestClassifier(n_estimators=960,max_depth=i,n_jobs=-1,random_state=90)
    score=cross_val_score(rfc,Xtrain,Ytrain,cv=5,scoring='roc_auc').mean()
    score1.append(score)
print(max(score1),param[score1.index(max(score1))])
plt.figure(figsize=[20,5])
plt.plot(param,score1)
plt.show()
#最优参数,max_depth=18

#调参max_features
score1=[]
param=np.arange(5,40,5)
for i in param:
    rfc=RandomForestClassifier(n_estimators=960,max_depth=18,max_features=i,n_jobs=-1,random_state=90)
    score=cross_val_score(rfc,Xtrain,Ytrain,cv=5,scoring='roc_auc').mean()
    score1.append(score)
print(max(score1),param[score1.index(max(score1))])
plt.figure(figsize=[20,5])
plt.plot(param,score1)
plt.show()
#最优参数,max_features=15

#网格搜索
from sklearn.model_selection import GridSearchCV
rfc=RandomForestClassifier(n_estimators=960,max_depth=18,max_features=15,n_jobs=-1,random_state=90)
para_grid={'min_samples_split':np.arange(1,10),'min_samples_leaf':np.arange(1,10)}
gs=GridSearchCV(rfc,param_grid=para_grid,cv=5,scoring='roc_auc')

#最优参数模型
gs_best=gs.best_estimator_

gs.best_score_
'''
0.9314588907764207
'''

rfc=gs_best.fit(Xtrain,Ytrain)
Ypred=rfc.predict(Xtrain)
Ypred_test=rfc.predict(Xtest)
#结果看起来在测试集上跟训练集上还是差一些,可以再调参试试。或者用过采样法试试
cm(Ytrain,Ypred,labels=[1,0])
'''
array([[ 1614,   467],
       [    8, 15632]], dtype=int64)
'''
cm(Ytest,Ypred_test,labels=[1,0])
'''
array([[ 384,  496],
       [ 213, 6503]], dtype=int64)
'''
阀值调整
rfc1=gs_best.fit(Xtrain,Ytrain)
#获取最佳阀值
threshold=get_rocauc(Xtrain,Ytrain,rfc1)

#根据阀值调整分类结果
ytrain_pred=get_ypred(Xtrain,rfc1,threshold)
ytest_pred=get_ypred(Xtest,rfc1,threshold)

#混淆矩阵
cm(Ytrain,ytrain_pred,labels=[1,0])
'''
array([[ 2011,    70],
       [  918, 14722]], dtype=int64)
'''

cm(Ytest,ytest_pred,labels=[1,0])
'''
array([[ 855,   25],
       [ 445, 6271]], dtype=int64)
'''
提交结果
rfc_done=gs_best.fit(X,y)
y_pred=rfc_done.predict_proba(test_x)[:,1]
result2=pd.DataFrame({'ID':test_id,'pred':y_pred})
result2.to_csv(r'E:\date\kesci\result_gs.csv',index=False)
这个结果提交到网站上的得分是:0.9295068509360562
因随机森林的调参过程比较慢,本文没有再测试过采样的方法下的效果。本项目提交的结果是要以概率的形式,所以阀值调整分类结果没法对线上评分造成影响。但是在实际应用上,阀值调整对于结果是会有很大的提高的。