数据挖掘实战之时间序列分析(比特币趋势预测)
本文在只考虑比特币以往的历史数据,不考虑其他外界相关的因素的前提下,通过构造ARMA时间序列模型,预测比特币平均价格的走势。
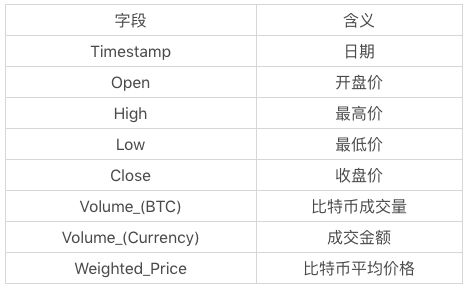
比特币历史数据源(从2012-01-01到2018-10-31)https://github.com/cystanford/bitcoin
1、加载数据
import numpy as np
import pandas as pd
import matplotlib.pyplot as plt
from statsmodels.tsa.arima_model import ARMA
import warnings
warnings.filterwarnings('ignore')
from itertools import product
from datetime import datetime
#加载数据
df = pd.read_csv(r'C:\Users\hzjy\Desktop\bitcoin_2012-01-01_to_2018-10-31.csv')#将时间作为df的索引
df.Timestamp = pd.to_datetime(df.Timestamp)
df.index = df.Timestamp2、采用数据可视化的方式查看比特币的历史走势
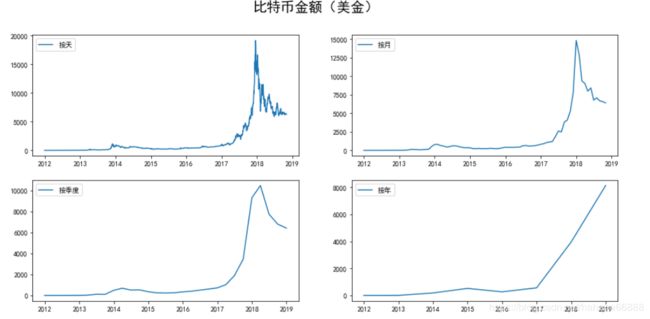
按照不同的时间尺度(天,月,季度,年)可以将数据压缩,得到不同尺度的数据,然后做可视化呈现。
#按照月、季度、年来统计
df_month = df.resample('M').mean()
df_Q = df.resample('Q-DEC').mean()
df_year = df.resample('A-DEC').mean()
#按天,月,季度,年来显示比特币的走势
fig = plt.figure(figsize=[15,7])
plt.rcParams['font.sans-serif'] = ['SimHei'] #用来正常显示中文标签
plt.suptitle('比特币金额(美金)',fontsize = 20) #绘制总图的标题
plt.subplot(221)
plt.plot(df.Weighted_Price,'-',label = '按天')
plt.legend()
plt.subplot(222)
plt.plot(df_month.Weighted_Price,'-',label = '按月')
plt.legend()
plt.subplot(223)
plt.plot(df_Q.Weighted_Price,'-',label = '按季度')
plt.legend()
plt.subplot(224)
plt.plot(df_year.Weighted_Price,'-',label = '按年')
plt.legend()
plt.show()3、构建ARMA时间序列模型
#设置参数范围
ps = range(0,3)
qs = range(0,3)
parameters = product(ps,qs)
parameters_list = list(parameters)
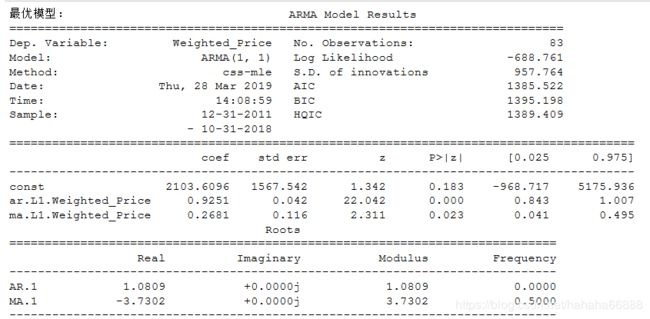
#寻找最优ARMA模型参数,即best_aic最小
results = []
best_aic = float('inf') #正无穷
for param in parameters_list:
try:
model = ARMA(df_month.Weighted_Price,order=(param[0],param[1])).fit()
except ValueError:
print('参数错误:',param)
continue
aic = model.aic
if aic < best_aic:
best_model = model
best_aic = aic
best_param = param
results.append([param,model.aic])#输出最优模型
result_table = pd.DataFrame(results)
result_table.columns = ['parameters','aic']
print('最优模型:',best_model.summary())4、比特币未来走势的预测
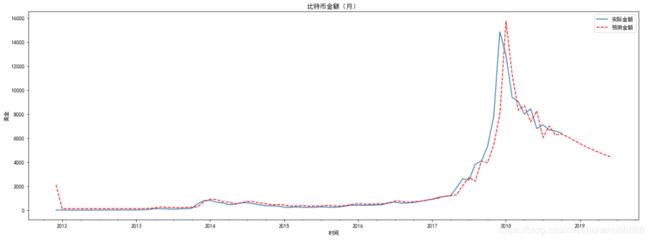
#比特币预测
df_month2 = df_month[['Weighted_Price']]
data_list = [datetime(2018,11,30),datetime(2018,12,31),datetime(2019,1,31),datetime(2019,2,28),datetime(2019,3,31),datetime(2019,4,30),datetime(2019,5,31),datetime(2019,6,30)]
future = pd.DataFrame(index = data_list,columns = df_month.columns)
df_month2 = pd.concat([df_month2,future])
df_month2['forecast'] = best_model.predict(start=0,end = 91)
#比特币预测结果显示
plt.figure(figsize=[20,7])
df_month2.Weighted_Price.plot(label='实际金额')
df_month2.forecast.plot(color = 'r',ls = '--',label= '预测金额')
plt.legend()
plt.title('比特币金额(月)')
plt.xlabel('时间')
plt.ylabel('美金')
plt.show()


