Python数据科学入门(seaborn)笔记05
Python数据科学入门笔记05——seaborn
seaborn 是matplotlib的扩展
一、seaborn 实现直方图和密度图
import numpy as np
import pandas as pd
import matplotlib.pyplot as plt
from pandas import Series,DataFrame

import seaborn as sns
s1 = Series(np.random.randn(1000))
# distplot() 可以同时绘制多个图,图名称=True
# 默认绘制hist和kde rug 显示分布密集度 更多参数看文档
sns.distplot(s1,hist=False,kde=True,rug=True)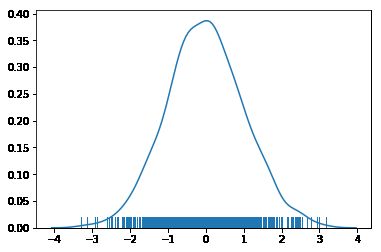
# 密度图
# shade 是否填充
# kdeplot() /  rugplot() 等
sns.kdeplot(s1,shade=True,color='r')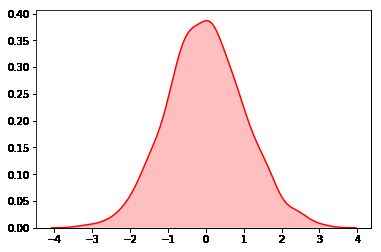
# 直接调用 matplotlib 的api
# 暂时未解决问题
sns.plt.hist(s1)
二、实现柱状图和热力图
# 下载  seaborn的数据作为实验数据
# seaborn 在github上有
df = sns.load_dataset('flights')
df.head()| year | month | passengers | |
|---|---|---|---|
| 0 | 1949 | January | 112 |
| 1 | 1949 | February | 118 |
| 2 | 1949 | March | 132 |
| 3 | 1949 | April | 129 |
| 4 | 1949 | May | 121 |
df.shape# 透视表 查看数据更方便
df = df.pivot(index='month',columns='year',values='passengers')
df.head()| year | 1949 | 1950 | 1951 | 1952 | 1953 | 1954 | 1955 | 1956 | 1957 | 1958 | 1959 | 1960 |
|---|---|---|---|---|---|---|---|---|---|---|---|---|
| month | ||||||||||||
| January | 112 | 115 | 145 | 171 | 196 | 204 | 242 | 284 | 315 | 340 | 360 | 417 |
| February | 118 | 126 | 150 | 180 | 196 | 188 | 233 | 277 | 301 | 318 | 342 | 391 |
| March | 132 | 141 | 178 | 193 | 236 | 235 | 267 | 317 | 356 | 362 | 406 | 419 |
| April | 129 | 135 | 163 | 181 | 235 | 227 | 269 | 313 | 348 | 348 | 396 | 461 |
| May | 121 | 125 | 172 | 183 | 229 | 234 | 270 | 318 | 355 | 363 | 420 | 472 |
# 热力图
sns.heatmap(df)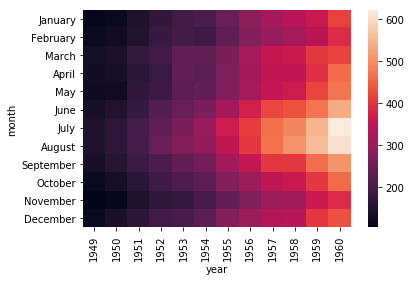
# 柱状图
s = df.sum()
sns.barplot(x=s.index,y=s.values)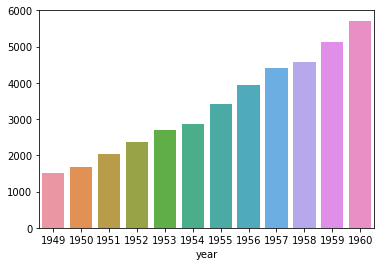
三、seaborn设置图像效果
1.set_style() 风格设置
x = np.linspace(0,14,100)

y1 = np.sin(x)
y2 = np.sin(x+2)*1.25
def sinplot():
plt.plot(x,y1)
plt.plot(x,y2)import seaborn as sns
# 设置风格 style : dict, None, or one of {darkgrid, whitegrid, dark, white, ticks}
# 设置风格 通过字典形式修改原有参数
sns.set_style("whitegrid",{'grid.color':'red'}) # 上面导入 seabron 后改变了图像的效果
sinplot()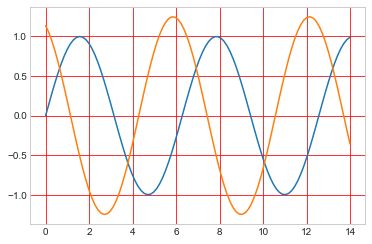
# 查看风格参数 可自行设置
sns.axes_style()
{'axes.facecolor': 'white',
'axes.edgecolor': '.8',
'axes.grid': True,
'axes.axisbelow': True,
'axes.linewidth': 1.0,
'axes.labelcolor': '.15',
'figure.facecolor': 'white',
'grid.color': 'red',
'grid.linestyle': '-',
'text.color': '.15',
'xtick.color': '.15',
'ytick.color': '.15',
'xtick.direction': 'out',
'ytick.direction': 'out',
'xtick.major.size': 0.0,
'ytick.major.size': 0.0,
'xtick.minor.size': 0.0,
'ytick.minor.size': 0.0,
'legend.frameon': False,
'legend.numpoints': 1,
'legend.scatterpoints': 1,
'lines.solid_capstyle': 'round',
'image.cmap': 'rocket',
'font.family': ['sans-serif'],
'font.sans-serif': ['Arial',
'DejaVu Sans',
'Liberation Sans',
'Bitstream Vera Sans',
'sans-serif']}
# 还原默认设置
sns.set()
sinplot()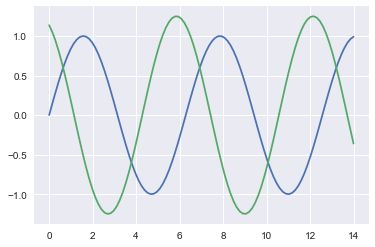
2.更改曲线属性 plotting_context() 和 set_context()
# seaborn 设置的 几种context
context = ['paper','notebook','talk','poster']
# rc={} 修改原有参数
sns.set_context(context[2],rc = {'grid.linewidth':3})
sinplot()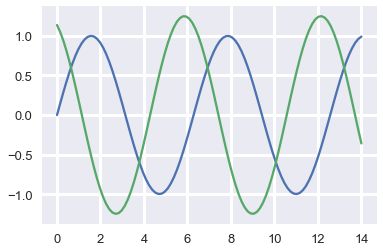
# 查看当前 context 参数
sns.plotting_context()
{'font.size': 15.600000000000001,
'axes.labelsize': 14.3,
'axes.titlesize': 15.600000000000001,
'xtick.labelsize': 13.0,
'ytick.labelsize': 13.0,
'legend.fontsize': 13.0,
'grid.linewidth': 3.0,
'lines.linewidth': 2.275,
'patch.linewidth': 0.39,
'lines.markersize': 9.1,
'lines.markeredgewidth': 0.0,
'xtick.major.width': 1.3,
'ytick.major.width': 1.3,
'xtick.minor.width': 0.65,
'ytick.minor.width': 0.65,
'xtick.major.pad': 9.1,
'ytick.major.pad': 9.1}
四、seaborn的调色功能
def sinplot2():
    x = np.linspace(0,14,100)
    plt.figure(figsize=(8,6))  # 设置画布大小
    for i in range(4):
        plt.plot(x,np.sin(x+i)*(i+0.75),label='sin(x+%s)*(%s+0.75)'%(i,i))
        plt.legend()
sinplot2()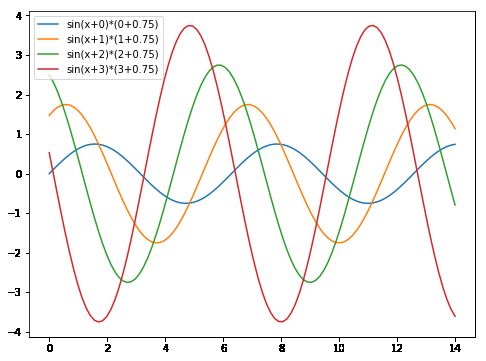
# 导入 seaborn 修饰图像
import seaborn as sns
sns.set_style(style='darkgrid')
sinplot2()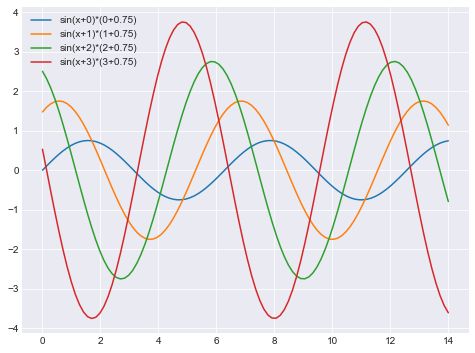
调色
sns.color_palette() # RGB 颜色取值[(0.12156862745098039, 0.4666666666666667, 0.7058823529411765),
(1.0, 0.4980392156862745, 0.054901960784313725),
(0.17254901960784313, 0.6274509803921569, 0.17254901960784313),
(0.8392156862745098, 0.15294117647058825, 0.1568627450980392),
(0.5803921568627451, 0.403921568627451, 0.7411764705882353),
(0.5490196078431373, 0.33725490196078434, 0.29411764705882354),
(0.8901960784313725, 0.4666666666666667, 0.7607843137254902),
(0.4980392156862745, 0.4980392156862745, 0.4980392156862745),
(0.7372549019607844, 0.7411764705882353, 0.13333333333333333),
(0.09019607843137255, 0.7450980392156863, 0.8117647058823529)]
# 绘制 color_palette() 颜色板
sns.palplot(sns.color_palette())
# coclor_palette 里定义的颜色名
pal_style = ['deep', 'muted', 'bright', 'pastel', 'dark', 'colorblind']sns.palplot(sns.color_palette('bright'))
设置调色板
sns.set_palette(sns.color_palette('bright'))# 修改颜色版 即颜色组合后后绘制的图像
sinplot2()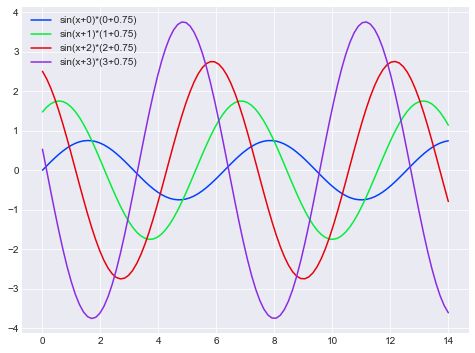
# 恢复默认风格
sns.set()
# 使用 with 语句 ,在with 语句中画图会使用其设置的风格
# 在 with 外使用默认风格
# 也就是说 with 临时设置风格
with sns.color_palette('dark'):
    sinplot2()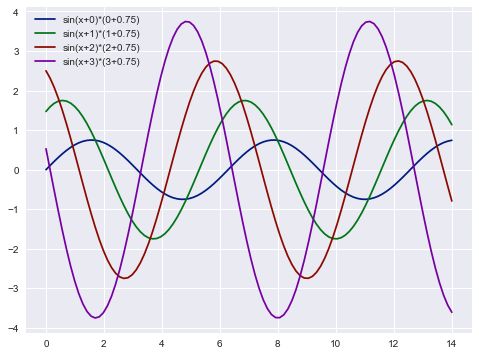
# 传入数值 设置自己的画板

# RGB 值
pal = sns.color_palette([(0.5,0.2,0.4),(0.3,0.9,0.2)])
sns.palplot(pal)
sns.palplot(sns.color_palette('hls',8))