数据科学 案例2 统计推断基础之房价预测(代码)
- 第6讲 统计推断基础
- 6.1 参数估计
- 1、进行描述性统计分析
- 2、置信度区间估计
- 1、法一(直接计算)
- 2、法二(定义函数计算)
- 3、法三(直接调用函数)
- 6.2 假设检验与单样本T检验
- 6.3 两样本T检验
- 6.4 方差分析
- 6.5 相关分析
- 6.6卡方检验
第6讲 统计推断基础
- 数据说明:本数据是地区房价增长率数据
- 名称-中文含义
- dis_name-小区名称
- rate-房价同比增长率
import os
import pandas as pd
house_price_gr = pd.read_csv(r'.\data\house_price_gr.csv', encoding='gbk')
house_price_gr.head()
|
dis_name |
rate |
| 0 |
东城区甘南小区 |
0.169747 |
| 1 |
东城区察慈小区 |
0.165484 |
| 2 |
东城区胡家园小区 |
0.141358 |
| 3 |
东城区台基厂小区 |
0.063197 |
| 4 |
东城区青年湖小区 |
0.101528 |
6.1 参数估计
1、进行描述性统计分析
house_price_gr.describe(include='all')
|
dis_name |
rate |
| count |
150 |
150.000000 |
| unique |
150 |
NaN |
| top |
怀柔区迎宾北路12号院 |
NaN |
| freq |
1 |
NaN |
| mean |
NaN |
0.110061 |
| std |
NaN |
0.041333 |
| min |
NaN |
0.029540 |
| 25% |
NaN |
0.080027 |
| 50% |
NaN |
0.104908 |
| 75% |
NaN |
0.140066 |
| max |
NaN |
0.243743 |
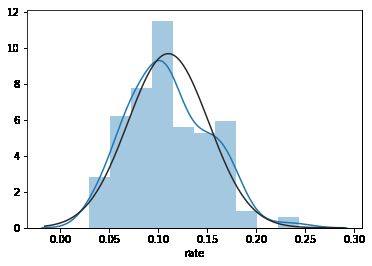
直方图
在统计学中,QQ图 是一种通过比较两个概率分布的分位数对这两个概率分布进行比较的概率图方法。首先选定分位数的对应概率区间集合,在此概率区间上,点对应于第一个分布的一个分位数x和第二个分布在和x相同概率区间上相同的分位数。因此画出的是一条含参数的曲线,参数为概率区间的分割数。
get_ipython().magic('matplotlib inline')
import seaborn as sns
from scipy import stats
sns.distplot(house_price_gr.rate,kde=True,fit=stats.norm)
蓝线和黑线完全重合:表示服从正态分布
import statsmodels.api as sm
from matplotlib import pyplot as plt
fig = sm.qqplot(house_price_gr.rate, fit=True, line='45')
fig.show()
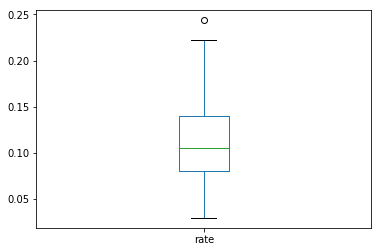
house_price_gr.plot(kind='box')
蓝线与红线完全重合表示服从正态分布
2、置信度区间估计
为什么是1.96?
P P P( μ \mu μ−1.96 σ n \frac{\sigma}{\sqrt{n}} n σ μ \mu μ+1.96 σ n \frac{\sigma}{\sqrt{n}} n σ)=0.95
1、法一(直接计算)
se = house_price_gr.rate.std() / len(house_price_gr) ** 0.5
LB = house_price_gr.rate.mean() - 1.96 * se
UB = house_price_gr.rate.mean() + 1.96 * se
(LB, UB)
(0.10344632517993363, 0.11667566822391268)
2、法二(定义函数计算)
def confint(x, alpha=0.05):
n = len(x)
xb = x.mean()
df = n-1
tmp = (x.std() / n ** 0.5) * stats.t.ppf(1-alpha/2, df)
return {'Mean': xb, 'Degree of Freedom':df, 'LB':xb-tmp, 'UB':xb+tmp}
confint(house_price_gr.rate, 0.05)
{'Mean': 0.11006099670192315,
 'Degree of Freedom': 149,
 'LB': 0.10339228338892809,
 'UB': 0.11672971001491822}
3、法三(直接调用函数)
d1 = sm.stats.DescrStatsW(house_price_gr.rate)
d1.tconfint_mean(0.05)
(0.10339228338892814, 0.11672971001491828)
6.2 假设检验与单样本T检验
当年住宅价格的增长率是否超过了10%的阈值
d1 = sm.stats.DescrStatsW(house_price_gr.rate)
print('t-statistic=%6.4f, p-value=%6.4f, df=%s' %d1.ttest_mean(0.1))
t-statistic=2.9812, p-value=0.0034, df=149.0
6.3 两样本T检验
(二分类与连续变量做两样本t检验)
导入数据
数据说明:本数据是一份汽车贷款数据
| 字段名 |
中文含义 |
| id |
id |
| Acc |
是否开卡(1=已开通) |
| avg_exp |
月均信用卡支出(元) |
| avg_exp_ln |
月均信用卡支出的自然对数 |
| gender |
性别(男=1) |
| Age |
年龄 |
| Income |
年收入(万元) |
| Ownrent |
是否自有住房(有=1;无=0) |
| Selfempl |
是否自谋职业(1=yes, 0=no) |
| dist_home_val |
所住小区房屋均价(万元) |
| dist_avg_income |
当地人均收入 |
| high_avg |
高出当地平均收入 |
| edu_class |
教育等级:小学及以下开通=0,中学=1,本科=2,研究生=3 |
creditcard= pd.read_csv(r'.\data\creditcard_exp.csv', skipinitialspace=True)
creditcard.head()
|
id |
Acc |
avg_exp |
avg_exp_ln |
gender |
Age |
Income |
Ownrent |
Selfempl |
dist_home_val |
dist_avg_income |
age2 |
high_avg |
edu_class |
| 0 |
19 |
1 |
1217.03 |
7.104169 |
1 |
40 |
16.03515 |
1 |
1 |
99.93 |
15.932789 |
1600 |
0.102361 |
3 |
| 1 |
5 |
1 |
1251.50 |
7.132098 |
1 |
32 |
15.84750 |
1 |
0 |
49.88 |
15.796316 |
1024 |
0.051184 |
2 |
| 2 |
95 |
0 |
NaN |
NaN |
1 |
36 |
8.40000 |
0 |
0 |
88.61 |
7.490000 |
1296 |
0.910000 |
1 |
| 3 |
86 |
1 |
856.57 |
6.752936 |
1 |
41 |
11.47285 |
1 |
0 |
16.10 |
11.275632 |
1681 |
0.197218 |
3 |
| 4 |
50 |
1 |
1321.83 |
7.186772 |
1 |
28 |
13.40915 |
1 |
0 |
100.39 |
13.346474 |
784 |
0.062676 |
2 |
creditcard.Acc.value_counts()
1    70
0    30
Name: Acc, dtype: int64
creditcard['Income'].groupby(creditcard['Acc']).describe()
|
count |
mean |
std |
min |
25% |
50% |
75% |
max |
| Acc |
|
|
|
|
|
|
|
|
| 0 |
30.0 |
3.149333 |
1.406482 |
1.5000 |
2.285000 |
2.905000 |
3.807500 |
8.40000 |
| 1 |
70.0 |
7.424706 |
3.077986 |
3.4939 |
5.175662 |
6.443525 |
8.494237 |
16.90015 |
Suc0 = creditcard[creditcard['Acc'] == 0]['Income']
Suc1 = creditcard[creditcard['Acc'] == 1]['Income']
leveneTestRes = stats.levene(Suc0, Suc1, center='median')
print('w-value=%6.4f, p-value=%6.4f' %leveneTestRes)
w-value=7.1829, p-value=0.0086
- 第二步:T-test(equal_var的取值不影响结论)
stats.stats.ttest_ind(Suc0, Suc1, equal_var=False)
Ttest_indResult(statistic=-9.529516968736448, pvalue=1.3263066753296544e-15)
creditcard['avg_exp'].groupby(creditcard['gender']).describe()
female= creditcard[creditcard['gender'] == 0]['avg_exp'].dropna()
male = creditcard[creditcard['gender'] == 1]['avg_exp'].dropna()
leveneTestRes = stats.levene(female, male, center='median')
print('w-value=%6.4f, p-value=%6.4f' %leveneTestRes)
stats.stats.ttest_ind(female, male, equal_var=True)
w-value=0.0683, p-value=0.7946
Ttest_indResult(statistic=-1.742901386808629, pvalue=0.08587122878448449)
6.4 方差分析
pd.set_option('display.max_columns', None)
creditcard.groupby('edu_class')[['avg_exp']].describe().T
|
edu_class |
0 |
1 |
2 |
3 |
| avg_exp |
count |
2.000000 |
23.000000 |
23.000000 |
22.000000 |
| mean |
207.370000 |
641.937826 |
973.321304 |
1422.280909 |
| std |
62.494097 |
147.577741 |
229.163196 |
435.281442 |
| min |
163.180000 |
418.780000 |
610.250000 |
816.030000 |
| 25% |
185.275000 |
525.595000 |
807.820000 |
1166.997500 |
| 50% |
207.370000 |
593.920000 |
959.830000 |
1343.025000 |
| 75% |
229.465000 |
736.140000 |
1075.270000 |
1661.412500 |
| max |
251.560000 |
987.660000 |
1472.820000 |
2430.030000 |
import statsmodels.api as sm
from statsmodels.formula.api import ols
sm.stats.anova_lm(ols('avg_exp ~ C(edu_class)',data=creditcard).fit())
|
df |
sum_sq |
mean_sq |
F |
PR(>F) |
| C(edu_class) |
3.0 |
8.126056e+06 |
2.708685e+06 |
31.825683 |
7.658362e-13 |
| Residual |
66.0 |
5.617263e+06 |
8.511005e+04 |
NaN |
NaN |
sm.stats.anova_lm(ols('avg_exp ~ C(edu_class)+C(gender)',data=creditcard).fit())
|
df |
sum_sq |
mean_sq |
F |
PR(>F) |
| C(edu_class) |
3.0 |
8.126056e+06 |
2.708685e+06 |
31.578365 |
1.031496e-12 |
| C(gender) |
1.0 |
4.178273e+04 |
4.178273e+04 |
0.487111 |
4.877082e-01 |
| Residual |
65.0 |
5.575481e+06 |
8.577662e+04 |
NaN |
NaN |
sm.stats.anova_lm(ols('avg_exp ~ C(edu_class)+C(gender)+C(edu_class)*C(gender)',data=creditcard).fit())
|
df |
sum_sq |
mean_sq |
F |
PR(>F) |
| C(edu_class) |
3.0 |
8.126056e+06 |
2.708685e+06 |
33.839350 |
3.753889e-13 |
| C(gender) |
1.0 |
4.178273e+04 |
4.178273e+04 |
0.521988 |
4.726685e-01 |
| C(edu_class):C(gender) |
3.0 |
8.761475e+05 |
2.920492e+05 |
3.648543 |
1.716862e-02 |
| Residual |
63.0 |
5.042862e+06 |
8.004544e+04 |
NaN |
NaN |
6.5 相关分析
creditcard.plot(x='Income', y='avg_exp', kind='scatter')
[外链图片转存失败,源站可能有防盗链机制,建议将图片保存下来直接上传(img-BxqxQYgo-1581821143045)(output_35_1.png)]
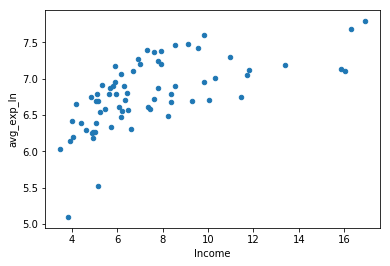
creditcard.plot(x='Income', y='avg_exp_ln', kind='scatter')
- 相关性分析:“spearman”,“pearson” 和 “kendall”
creditcard[['avg_exp_ln', 'Income']].corr(method='pearson')
|
avg_exp_ln |
Income |
| avg_exp_ln |
1.00000 |
0.63489 |
| Income |
0.63489 |
1.00000 |
6.6卡方检验
cross_table = pd.crosstab(creditcard.edu_class, columns=creditcard.Acc)
cross_table
| Acc |
0 |
1 |
| edu_class |
|
|
| 0 |
16 |
2 |
| 1 |
14 |
23 |
| 2 |
0 |
23 |
| 3 |
0 |
22 |
cross_table_rowpct = cross_table.div(cross_table.sum(1),axis = 0)
cross_table_rowpct
| Acc |
0 |
1 |
| edu_class |
|
|
| 0 |
0.888889 |
0.111111 |
| 1 |
0.378378 |
0.621622 |
| 2 |
0.000000 |
1.000000 |
| 3 |
0.000000 |
1.000000 |
print('chisq = %6.4f\n p-value = %6.4f\n dof = %i\n expected_freq = %s' %stats.chi2_contingency(cross_table))
chisq = 50.0930
 p-value = 0.0000
 dof = 3
 expected_freq = [[ 5.4 12.6]
 [11.1 25.9]
 [ 6.9 16.1]
 [ 6.6 15.4]]


