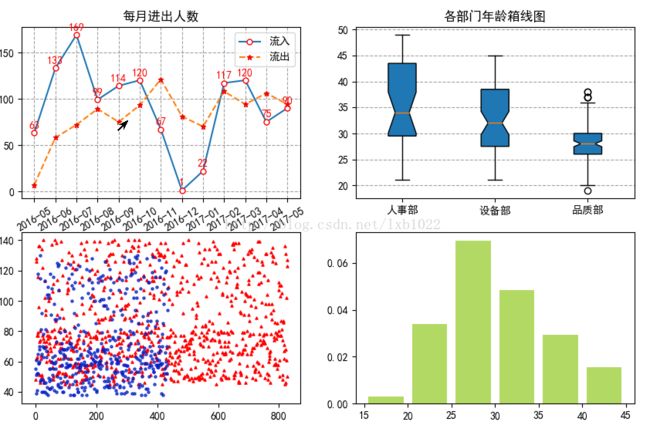
matplotlib与pyecharts:折线图、箱线图、散点图、直方图
matplotlib折线图、箱线图、散点图、直方图代码
#coding:utf-8
import numpy as np
import pandas as pd
import matplotlib.pyplot as plt
plt.rcParams['font.sans-serif'] = ['simhei']
plt.rcParams['font.family']='sans-serif'
df = pd.read_excel("/home/soft/person.xls")
#进入日期
dfin = df.loc[:,['num','in']]
dfin['in'] = pd.to_datetime(dfin['in'])
dfin = dfin.set_index('in')
dfin = dfin.loc['2016-5-1':'2017-5-31',:]
dfin = dfin.resample('M').count().to_period('M')
#出走日期
dfout = df.loc[:,['num','out']]
dfout['out'] = pd.to_datetime(dfout['out'])
dfout = dfout.set_index('out')
dfout = dfout.loc['2016-5-1':'2017-5-31',:]
dfout = dfout.resample('M').count().to_period('M')
fig = plt.figure()
ax1 = fig.add_subplot(221)
x1=range(len(dfin.index))
y1=list(dfin['num'])
x2=range(len(dfout.index))
y2=list(dfout['num'])
h0 = ax1.plot(x1,y1,marker='o',mec='r',mfc='w',ms=5)
h1 = ax1.plot(x2,y2,marker='*',mec='r',mfc='g',ms=5,ls='--')
ax1.set_title(u'每月进出人数')
ax1.set_xticks(x1)
ax1.set_xticklabels(dfin.index,rotation=30)
for i in x1:
    ax1.text(x1[i],y1[i]+8,y1[i],horizontalalignment='center',verticalalignment='center',color='r')
ax1.grid(True, linestyle='--',color='grey', alpha=.75)
ax1.legend((h0[0],h1[0]),(u'流入',u'流出'))
#箱线图
ax2 = fig.add_subplot(222)
rsb = df[df['department']==u'人事部']['age']
sbb = df[df['department']==u'设备部']['age']
pzb = df[df['department']==u'品质部']['age']
ax2.boxplot([rsb,sbb,pzb],notch=True,vert=True,patch_artist=True)
ax2.set_xticklabels([u'人事部',u'设备部',u'品质部'])
ax2.set_title(u'各部门年龄箱线图')
ax2.yaxis.grid(True, linestyle='--',color='grey', alpha=.75)
#散点图,男女体重分布图
ax3 = fig.add_subplot(223)
boyy = df[df['gender']==u'男']['weight']
girly = df[df['gender']==u'女']['weight']
x1 = range(len(boyy))
x2 = range(len(girly))
ax3.scatter(x1,boyy,c='r',s=5,marker='^')
ax3.scatter(x2,girly,c='g',s=5,alpha=0.75,edgecolors= 'b')
#直方图
ax4 = fig.add_subplot(224)
age = df['age']
bins=range(15,50,5)
ax4.hist(age,bins,normed=1,alpha=0.75,histtype='bar',facecolor='yellowgreen',rwidth=0.8)
plt.show()
