深度学习案例:用tensorflow2.0实现Fashion-MNIST数据集分类
序言:Fashion-MNIST数据集简介
Fashion-MNIST是一个替代MNIST手写数字集的图像数据集。 它是由Zalando(一家德国的时尚科技公司)旗下的研究部门提供。其涵盖了来自10种类别的共7万个不同商品的正面图片。Fashion-MNIST的大小、格式和训练集/测试集划分与原始的MNIST完全一致。60000/10000的训练测试数据划分,28x28的灰度图片。你可以直接用它来测试你的机器学习和深度学习算法性能,且不需要改动任何的代码。
论文网址:https://arxiv.org/abs/1708.07747
GitHub地址:https://github.com/zalandoresearch/fashion-mnist
图形化示例如下图所示。
一、导入数据
import tensorflow as tf
(x_train, y_train), (x_test, y_test) = tf.keras.datasets.fashion_mnist.load_data()
还有一种方法是提前下载数据集然后放在./data/fashion文件夹下,通过如下代码导入数据:
from tensorflow.examples.tutorials.mnist import input_data
#如果提示No module named 'tensorflow.examples.tutorials' 可参考https://blog.csdn.net/qq_43060552/article/details/103189040
mnist = input_data.read_data_sets('data/fashion', one_hot = True)
#如果读取经典mnist数据集,参数需改为("MNIST_data", one_hot=True),不加one_hot=True,类别用阿拉伯数字0~9标注
建议用第一种方法,因第二种方法tensorflow2.0已不推荐使用,将来会弃用。
tensorflow 2.0 版本直接一行代码即可导入数据集,返回训练集和测试集两个tuple,每个tuple各包含两个numpy.ndarray,分别对应于(x_train, y_train), (x_test, y_test) 。
二、探索数据
(1) 基本描述信息
print( "x_train shape:", x_train.shape, "y_train shape:", y_train.shape) #x_train shape: (60000, 28, 28) y_train shape: (60000,)
print( "x_test shape:", x_test.shape, "y_test shape:", y_test.shape) #x_test shape: (10000, 28, 28) y_test shape: (10000,)
print(y_train[:20]) #显示前20个label值,可以看到类别用阿拉伯数字表示
print(len(x_train)) #显示训练集的样本个数
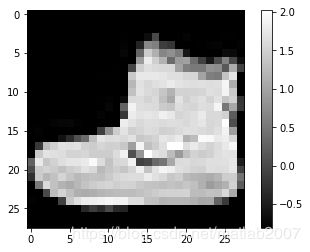
(2) 显示单张图片
plt.imshow(x_train[0], cmap = 'gray') #改为黑白时,cmap = 'binary'
plt.colorbar()
plt.grid(False)
plt.show()
(3) 显示很多张图片
class_names = ['T-shirt', 'Trouser', 'Pullover', 'Dress', 'Coat', 'Sandal', 'Shirt', 'Sneaker', 'Bag', 'Ankle boot']
plt.figure(figsize=(10,10))
for i in range(25):
    plt.subplot(5,5,i+1)
    plt.xticks([])
    plt.yticks([])
    plt.grid(False)
    plt.imshow(x_train[i], cmap=plt.cm.binary)
    plt.xlabel(class_names[y_train[i]])
plt.show()
x_train = x_train / 255.0
x_test = x_test / 255.0
第二种方法:
from sklearn.preprocessing import StandardScaler
ss = StandardScaler()
x_train = ss.fit_transform(x_train.astype(np.float32).reshape(-1,1)).reshape(-1,28,28)
x_test = ss.transform(x_test.astype(np.float32).reshape(-1,1)).reshape(-1,28,28)
#x_train.astype(np.float32).reshape(-1,1)  ===> (47040000, 1)
因为训练集(60000, 28, 28)和测试集(100000, 28, 28)的特征为三维,而fit_transform不支持三维数据所以需要进行过reshape。
三、构建模型
(1) 定义层
model = keras.models.Sequential([keras.layers.Flatten(input_shape = (28, 28)),
    keras.layers.Dense(128, activation ='relu'),
    keras.layers.Dense(10, activation ='softmax')
])
(2) 编译模型
model.compile(optimizer='adam',
              loss=tf.keras.losses.SparseCategoricalCrossentropy(from_logits=True),
              metrics=['accuracy'])
参数作用如下,直接导入英文避免赘述:
Loss function —This measures how accurate the model is during training. You want to minimize this function to “steer” the model in the right direction.
Optimizer —This is how the model is updated based on the data it sees and its loss function.
Metrics —Used to monitor the training and testing steps. The following example uses accuracy, the fraction of the images that are correctly classified.
备注:因类标号非one hot编码,所以定义为sparse;因为是分类问题,所以为Categorical;损失函数为交叉熵Crossentropy。
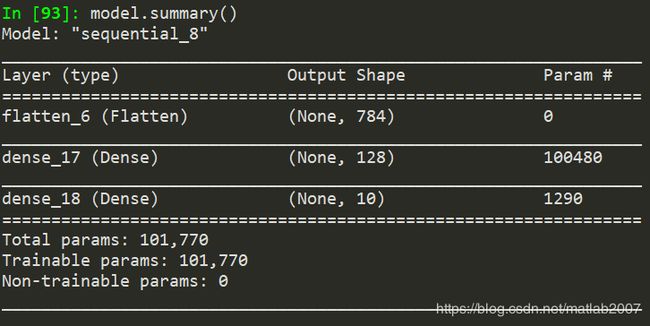
(3) 考察模型
model.summary()
四、训练模型与模型评价
(1) 训练集训练模型
history = model.fit(x_train, y_train, epochs=10)
history.history #显示loss和accuracy的历史
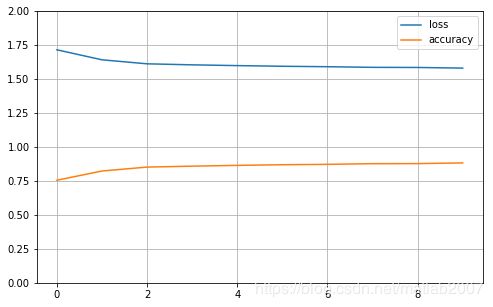
model.fit方法的返回值存入history变量,可以图形化形式显示训练过程中loss和accuracy的变化。
def plot_learning_curves(history):
    pd.DataFrame(history.history).plot(figsize = (8, 5))
    plt.grid(True)
    plt.gca().set_ylim(0,2)
    plt.show()
plot_learning_curves(history)
(2) 评价模型的准确率
test_loss, test_acc = model.evaluate(x_test, y_test, verbose=2)
print('\nTest accuracy:', test_acc)
![]()
五、实际预测
predictions = model.predict(x_test)
print(predictions[0])
print('预测为第%d类,属于该类的概率为%.2f%%' %(np.argmax(predictions[0]),
                           max((predictions[0]))*100))


