使用fsl进行MRI脑图像分析
使用fsl进行MRI脑图像分析
MED620122 生物医学工程进展
1 安装教程
软件与系统版本
- FLIRT version 6.0
- Ubuntu 16.04
- FSLeyes version 0.31.0+build0(这里有个坑是,fsl本身也自带fsleyes,但是版本较低,有些功能使用会有问题,需要单独下载fsleyes然后替换)
首先,去官网下载fslinstaller.py 选择 “Download FSL”
然后参考官网的安装教程,进行安装
https://fsl.fmrib.ox.ac.uk/fsl/fslwiki/FslInstallation/Linux
sudo python2 fslinstaller.py
下载速度比较慢,耐心等待安装完成后,由于本人是用shell运行的,要配置环境变量,参考如下网页配置环境变量:
https://fsl.fmrib.ox.ac.uk/fsl/fslwiki/FslInstallation/ShellSetup
把如下的命令加到~/.bash_profile文件的后面,再重新打开shell即可
FSLDIR=/usr/local/fsl
. ${FSLDIR}/etc/fslconf/fsl.sh
PATH=${FSLDIR}/bin:${PATH}
export FSLDIR PATH
然后如果配置成功,输入flirt -version可以返回软件的版本,例如:FLIRT version 6.0
如果想测试安装是否成功,可以下载FSL评估和示例数据套件(FEEDS),课程学习网址:https://fsl.fmrib.ox.ac.uk/fsl/fslwiki/FEEDS
按照教程,下载解压完成后,输入/usr/bin/time ./RUN all 即可进行评估
https://users.fmrib.ox.ac.uk/~paulmc/fsleyes/userdoc/latest/
此处有个大坑是,fsleyes默认在fsl里面有安装,但是其版本是老版本,我尝试的时候,3Dview的功能就不能使用,此时需要到fsleyes的网站上单独安装
- fsleyes的网站:https://users.fmrib.ox.ac.uk/~paulmc/fsleyes/userdoc/latest/install.html#
- fsleyes安装教程(替换fsl内置版本):https://fsl.fmrib.ox.ac.uk/fsl/fslwiki/FSLeyes
- fsleyes UserGuide:https://users.fmrib.ox.ac.uk/~paulmc/fsleyes/userdoc/latest/
2 fsl Course
首先,进入fsl Course的官网下载示例数据,学习图像分割,http://fsl.fmrib.ox.ac.uk/fslcourse/
示例学习主要是参考:http://fsl.fmrib.ox.ac.uk/fslcourse/lectures/practicals/seg_struc/index.html
主要是用到了以下两个部分的数据
wget -c http://fsl.fmrib.ox.ac.uk/fslcourse/downloads/structural.tar.gz
wget -c http://fsl.fmrib.ox.ac.uk/fslcourse/downloads/registration.tar.gz
2.1 bet去除颅骨
首先,进入~/fsl/seg_struc/fast目录,解压示例图像,然后再使用bet进行分割
gunzip structural.nii.gz
bet structural.nii structural_brain
gunzip structural_brain.nii.gz
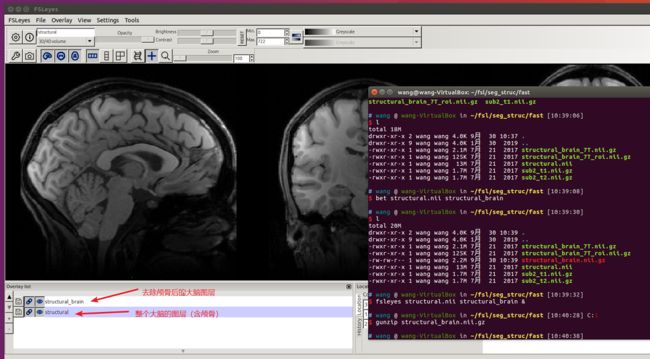
fsleyes structural.nii structural_brain.nii &
fsleyes用于可视化检测“去除颅骨的效果”
2.2 fslroi选取感兴趣区域
也可以使用fslroi选取感兴趣的区域,再加载进fsleye
fslroi structural_brain structural_brain_roi 0 175 0 185 100 5
2.3 FAST分割+偏置场校正
示例中还有输入Fast GUI命令,进行偏置场校正及分割,设置同官网,进行校正。
输出3类,输出选项全都勾上,然后iteration共10次
Use the GUI (Fast [or Fast_gui on a Mac]) and turn on the Estimated bias fieldbutton (which saves a copy of the bias field) and **Restored input button **(which corrects the original image with the calculated bias field). For both images also open the Advanced Options tab and change the Number of iterations for bias field removal to 10 to account for the strong bias fields in both cases.
此时并没有配准到MNI152的空间!
关于为何选择输出3类:
Now choose the Number of classes to be segmented. Normally you will want 3 (Grey Matter, White Matter and CSF). However, if there is very poor grey/white contrast you may want to reduce this to 2; alternatively, if there are strong lesions showing up as a fourth class, you may want to increase this. Also, if you are segmenting T2-weighted images, you may need to select 4 classes so that dark non-brain matter is processed correctly (this is not a problem with T1-weighted as CSF and dark non-brain matter look similar).
PS:下图中选项中是选择6类,注意改成3类
2.4 Partial Volume Segmentation 图像分割结果##
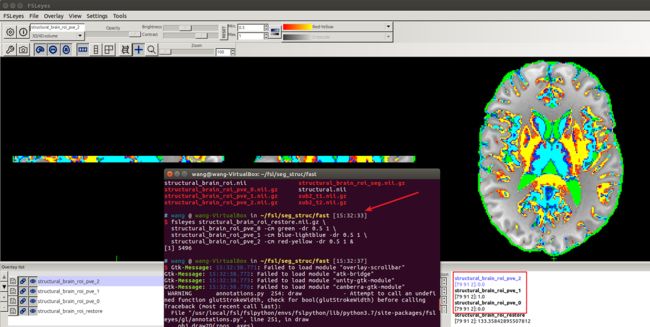
fsleyes structural_brain_roi_restore \
  structural_brain_roi_pve_0 -cm green -dr 0.5 1 \
  structural_brain_roi_pve_1 -cm blue-lightblue -dr 0.5 1 \
  structural_brain_roi_pve_2 -cm red-yellow -dr 0.5 1 &
下图就是图像分割结果,不同颜色分别代表GM, WM, CSF;灰质,白质,脑脊液。
- 脑脊液(绿色pve0)
- 灰质(蓝色pve1)
- 白质(红黄pve2)
各种组织分割的结果如下:
*pve_*文件表示每类的概率,没有进行二值化*seg_*文件表示每类分割结果,进行过二值化bias文件为偏置场。
2.5 fslstats 统计##
第一个数字表示整个图像上GM(pve1是灰质)的平均体素,就是个百分比,第二个是整张图体素数目,第三个数字是图像的总体积(单位:立方毫米),忽略了所有的零体素(就是脑袋外的体素不算在内),将第一和第三个数字相乘可以得到GM的总体积。
2.6 FIRST 皮层下结构分割及统计分析##
首先,进入~/fsl/seg_struc/first目录
run_first_all -i con0047_brain -b -s L_Hipp,L_Amyg \
  -o con0047 -a con0047_brain_to_std_sub.mat
-a指定了仿射配准的矩阵,这个步骤也可以自动完成
-s指定要分割的部分,此处是L_Hipp,L_Amyg
将图像con0047_brain_to_std_sub.nii.gz与“1mm标准空间模板图像”一起加载到FSLeyes中。查看皮层下结构的对齐方式,两者都是MNI152 space,所以非常接近。
后面对于分割不满意,还可以Boundary corrected segmentation output,将边界重新进行调整。
Vertex Analysis
照样是跟着教程来,换了一个文件夹,在fsl/seg_struc/first/shapeAnalysis下面运行的。
- 首先,使用
concat_bvars把顶点信息文件bvars整合成一个,注意此时整合的顺序和后序design matrix的要保持一致 - 接着,打开
Glm,按照教程上的进行配置: - Create a design matrix (Don’t worry if you don’t fully understand this part, we will cover this in more detail later in the course).The subject order should match the order in which the .bvars were combined in the concat_bvars call. The design matrix is most easily created using FSL’s Glm tool (a single column file). To do this, start the Glm GUI (Glm_gui on mac). First, choose the Higher-level/non-timeseries design option from the top pull down menu in the small window. Next, set the # inputs option to be 8 (the number of subjects we have in this example).
- In the bigger window (of the Glm GUI) set the values of the EV (the numbers in the second column) to be -1 for the first five entries (our five controls) and +1 for the next three entries (our three patients). This will allow us probe the difference between groups. Leave the ‘group’ column as all ones. Once you’ve done this, go to the Contrasts and F-tests tab. Rename the t-contrast (C1) to ‘group difference’, but leave the value set for EV1 as 1. We also need to add an F-test. Change the number in the F-tests box to 1, and then highlight the button on the right hand side (under F1) to select an F-test that operates on the single t-contrast.This F-test will be the main contrast of interest for our vertex analysis as it allows us to test for differences in either direction.
- When this is all set up correctly, save everything using the Save button in the smaller Glm window. Choose the current directory and use the name design_con1_dis2 (as we will assume this is the name used below, although for your own studies you can use any name of your choice). Now exit the Glm GUI.
- 然后,使用
randomise进行统计检验 - 最后,用
fsleyes可视化。
全部命令如下:
concat_bvars all.bvars *L_Hipp*.bvars
# 我的理解是,该步骤把不同subject的bvars整合出来的文件,使用--useReconMNI参数,重构到MNI空间。Reconstructs the meshes in MNI space(native space of the model).
first_utils --usebvars --vertexAnalysis -i all.bvars -o diff_con1_dis2_L_Hipp_mni -d design_con1_dis2.mat --useReconMNI
# 在重构好的空间里,进行统计检验
randomise -i diff_con1_dis2_L_Hipp_mni.nii.gz \
  -m diff_con1_dis2_L_Hipp_mni_mask.nii.gz \
  -o con1_dis2_L_Hipp_rand -d design_con1_dis2.mat \
  -t design_con1_dis2.con -f design_con1_dis2.fts \
  --fonly -D -F 3
# 可视化有差异的地方(都在MNI152空间)
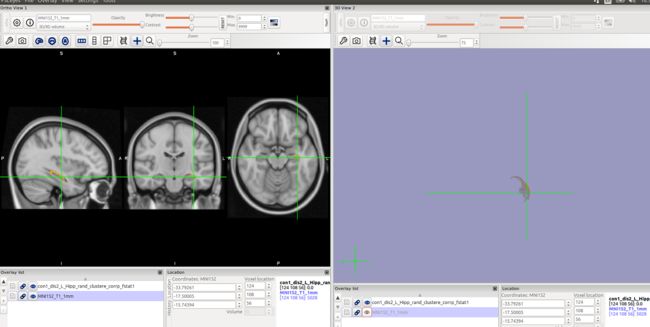
fsleyes -std1mm con1_dis2_L_Hipp_rand_clustere_corrp_fstat1 -cm red-yellow -dr 0.95 1 &
最后可视化,橘黄色部分应该就是存在差异的地方:
当然,UserGuide里面也有相似的内容,也跑了一下,比较坑的是,UserGuide内容较老,里面有张图是用FSLView可视化的,现在该工具已经弃用,另一张图按照示例代码(见下方),对应着改了下文件,也没有做出来有不同颜色和箭头(UserGuide说箭头要另做)的样子。做出来的图如下:
UserGuide链接:
https://fsl.fmrib.ox.ac.uk/fsl/fslwiki/FIRST/UserGuide
# 此处的不同之处在于,是在原来图像的空间进行重构
# --useReconNative : Reconstructs the meshes in the native space of the image. For vertex-wise stats need to also use --useRigidAlign.
# --useRigidAlign : Uses a 6 Degrees Of Freedom transformation to remove pose from the meshes (see --useScale if you wish to remove size as well). All meshes are aligned to the mean shape from the shape Model. Can be used with either ReconNative or ReconMNI.
first_utils --vertexAnalysis --surfaceout --usebvars -i con_to_dis_L_Hipp.bvars -d con1_dis2.mat -o shape_analysis/con1_dis2_L_Hipp --useReconNative --useRigidAlign -v >& shape_analysis/con1_dis2_L_Hipp_output.txt

# 生成一个有pvals的文件,与之前的vtk文件内容一致
surface_fdr con1_dis2_L_Hipp1.vtk
3 Homework data analysis
3.1 bet去除颅骨
使用类似如下命令去除颅骨,然后放入fsleyes进行可视化
bet CC0007_philips_15_62_M.nii CC0007_philips_15_62_M_brain
# fsl可视化
fsleyes *_brain.nii.gz &
3.2 FAST分割+偏置场校正
使用如下命令进行FAST分割和偏置场校正,具体说明见上面,也是使用Fast GUI设置的
此时的偏置场校正并没有配准到MNI152的空间!
/usr/local/fsl/bin/fast -t 1 -n 3 -H 0.1 -I 10 -l 20.0 -g -B -b -o /home/wang/BME_Homework/CC0003_philips_15_63_F_brain /home/wang/BME_Homework/CC0003_philips_15_63_F_brain
/usr/local/fsl/bin/fast -t 1 -n 3 -H 0.1 -I 10 -l 20.0 -g -B -b -o /home/wang/BME_Homework/CC0004_philips_15_67_M_brain /home/wang/BME_Homework/CC0004_philips_15_67_M_brain
/usr/local/fsl/bin/fast -t 1 -n 3 -H 0.1 -I 10 -l 20.0 -g -B -b -o /home/wang/BME_Homework/CC0005_philips_15_62_M_brain /home/wang/BME_Homework/CC0005_philips_15_62_M_brain
/usr/local/fsl/bin/fast -t 1 -n 3 -H 0.1 -I 10 -l 20.0 -g -B -b -o /home/wang/BME_Homework/CC0006_philips_15_63_F_brain /home/wang/BME_Homework/CC0006_philips_15_63_F_brain
/usr/local/fsl/bin/fast -t 1 -n 3 -H 0.1 -I 10 -l 20.0 -g -B -b -o /home/wang/BME_Homework/CC0007_philips_15_62_M_brain /home/wang/BME_Homework/CC0007_philips_15_62_M_brain
/usr/local/fsl/bin/fast -t 1 -n 3 -H 0.1 -I 10 -l 20.0 -g -B -b -o /home/wang/BME_Homework/CC0008_philips_15_60_F_brain /home/wang/BME_Homework/CC0008_philips_15_60_F_brain
3.3 Partial Volume Segmentation 图像分割结果##
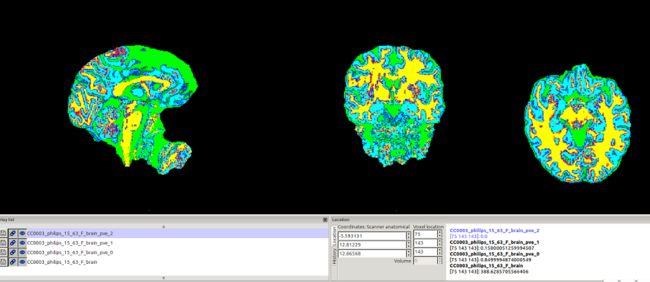
fsleyes CC0003_philips_15_63_F_brain \
  CC0003_philips_15_63_F_brain_pve_0 -cm green -dr 0.5 1 \
  CC0003_philips_15_63_F_brain_pve_1 -cm blue-lightblue -dr 0.5 1 \
  CC0003_philips_15_63_F_brain_pve_2 -cm red-yellow -dr 0.5 1 &
fsleyes CC0005_philips_15_62_M_brain \
  CC0005_philips_15_62_M_brain_pve_0 -cm green -dr 0.5 1 \
  CC0005_philips_15_62_M_brain_pve_1 -cm blue-lightblue -dr 0.5 1 \
  CC0005_philips_15_62_M_brain_pve_2 -cm red-yellow -dr 0.5 1 &
- 脑脊液(绿色pve0)
- 灰质(蓝色pve1)
- 白质(红黄pve2)
3.3 fslstats 统计##
使用xargs命令批量拿出来脑脊液,灰质和白质的体积。(-I {} 大括号指定替换的符号)
ls *_pve_*|xargs -I {} $FSLDIR/bin/fslstats {} -M -V
- 脑脊液(pve0)
- 灰质(pve1)
- 白质(pve2)
统计汇总如下:
与使用matlab toolkit中CAT做出来的体积略有不同,差别最大的是CC0007,CAT做出来CC0007的灰质比白质略小,这里CC0007的灰质比白质略大
| 病人编号 | 组织类别 | 整张图体素数目 | 图像的总体积(立方毫米) | 百分比 | 对应结构的体素数目 | 对应结构的体积(立方厘米) |
|---|---|---|---|---|---|---|
| CC0003 | 脑脊液 | 498338 | 393750.4688 | 0.699085 | 348380.6207 | 275.2650464 |
| CC0003 | 灰质 | 978755 | 773341.125 | 0.718218 | 702959.4586 | 555.4275161 |
| CC0003 | 白质 | 731029 | 577606 | 0.789414 | 577084.527 | 455.9702629 |
| CC0004 | 脑脊液 | 664398 | 524961.8125 | 0.714634 | 474801.4003 | 375.1555599 |
| CC0004 | 灰质 | 1209274 | 955485.5625 | 0.720517 | 871302.4747 | 688.443591 |
| CC0004 | 白质 | 994846 | 786059.25 | 0.815883 | 811677.939 | 641.3323791 |
| CC0005 | 脑脊液 | 600755 | 474675.2188 | 0.70273 | 422168.5612 | 333.5685165 |
| CC0005 | 灰质 | 1201045 | 948983 | 0.730482 | 877341.7537 | 693.2149998 |
| CC0005 | 白质 | 932851 | 737074.5625 | 0.79763 | 744069.9431 | 587.9127833 |
| CC0006 | 脑脊液 | 490649 | 387674.8125 | 0.689181 | 338145.9685 | 267.178115 |
| CC0006 | 灰质 | 1082499 | 855311.25 | 0.740182 | 801246.2748 | 633.0859916 |
| CC0006 | 白质 | 845774 | 668268.5 | 0.807705 | 683135.8887 | 539.7638088 |
| CC0007 | 脑脊液 | 638762 | 504700.125 | 0.720264 | 460077.2732 | 363.5173308 |
| CC0007 | 灰质 | 1183335 | 934979.3125 | 0.729251 | 862948.2321 | 681.8345986 |
| CC0007 | 白质 | 1025489 | 810261.8125 | 0.831084 | 852267.5001 | 673.3956282 |
| CC0008 | 脑脊液 | 467768 | 369597.4063 | 0.685212 | 320520.2468 | 253.2525779 |
| CC0008 | 灰质 | 1026966 | 811436.3125 | 0.741014 | 760996.1835 | 601.2856677 |
| CC0008 | 白质 | 797140 | 629843.9375 | 0.805895 | 642411.1403 | 507.58808 |
3.4 FIRST 皮层下结构分割及统计分析##
- 此处设置分割左右尾状核
- 此处没有设定仿射变换矩阵(Course教程中有指定变换矩阵mat文件,是因为他配准过了,要节省时间)
结果文件中_to_std_sub.nii.gz才是配准到了MNI152空间
run_first_all -i CC0003_philips_15_63_F_brain -b -s L_Caud,R_Caud -o CC0003
run_first_all -i CC0004_philips_15_67_M_brain -b -s L_Caud,R_Caud -o CC0004
run_first_all -i CC0005_philips_15_62_M_brain -b -s L_Caud,R_Caud -o CC0005
run_first_all -i CC0006_philips_15_63_F_brain -b -s L_Caud,R_Caud -o CC0006
run_first_all -i CC0007_philips_15_62_M_brain -b -s L_Caud,R_Caud -o CC0007
run_first_all -i CC0008_philips_15_60_F_brain -b -s L_Caud,R_Caud -o CC0008
- -b specifies that the input image is brain extracted - important when calculating the registration.
- -s allows a restricted set of structures (one or more) to be selected. For more than one structure the list must be comma separated with no spaces. The list of possible structures is: L_Accu L_Amyg L_Caud L_Hipp L_Pall L_Puta L_Thal R_Accu R_Amyg R_Caud R_Hipp R_Pall R_Puta R_Thal BrStem. 这个参数不指定的话,会把所有结构都分割出来,然后firstseg和origsegs文件里面就是有很多的结构,并且用不同的数值进行了标记
这一步骤,生成了all_fast_firstseg.nii.gz和all_fast_origsegs.nii.gz两个文件,其中firstseg是校正过后的文件,origseg是校正前的文件。
一般都是使用firstseg是校正过后的文件,校正前的文件分了组织的“边界”和“内部”像素,“边界”的像素=“内部”像素的值+100。
- The corrected image (*_firstseg) is normally the one that you would use to define an ROI or mask for a particular subcortical structure.
- For more details on the uncorrected image (*_origsegs) – see the optional practical at the end.
此处,由于我只指定了尾状核,所以使用如下命令,可视化不同样本的尾状核,下图是三个方向看的结构
Make sure that you look at the axial, coronal and sagittal slices.
first_roi_slicesdir *nii *all_fast_firstseg.nii.gz
后续还可以自己再进行边界校正**“Boundary Correction”**,具体使用方法为:first_boundary_corr -s segmented_image -i intensity_image -b method -o output_name,此处我没有进行校正。
参考文档:https://fsl.fmrib.ox.ac.uk/fsl/fslwiki/FIRST/UserGuide
3.5 Vertex Analysis
这一部分的目的是:localised change in shape and/or size
For vertex analysis, we will be using the .bvars files as they contain the information about the sub-voxel mesh coordinates.
Combine all the mode parameters (.bvars file) into a single file. Each structure (model) that is fit with FIRST will generate a separate .bvars file. For a given structure (e.g. Caud尾状核) combine all the relevant .bvars files using the concat_bvars script.
Note that the order here is very important, as it must correspond to the order specified in the design matrix to be used later for statistical testing. For this example, combine the .bvars files (all of the left Caud 和 right Caud 分别左右尾状核) using the command:
concat_bvars命令把bvars文件合并,此处的顺序会影响后面design的设计,所以事先指定好,然后输入Glm创建design分组信息矩阵,具体如何创建分组信息矩阵,可以参考UserGuide:https://fsl.fmrib.ox.ac.uk/fsl/fslwiki/FEAT/UserGuide
concat_bvars all.L_Caud.bvars CC0003-L_Caud_first.bvars CC0006-L_Caud_first.bvars CC0008-L_Caud_first.bvars CC0004-L_Caud_first.bvars CC0005-L_Caud_first.bvars CC0007-L_Caud_first.bvars
concat_bvars all.R_Caud.bvars CC0003-R_Caud_first.bvars CC0006-R_Caud_first.bvars CC0008-R_Caud_first.bvars CC0004-R_Caud_first.bvars CC0005-R_Caud_first.bvars CC0007-R_Caud_first.bvars
接着,使用first_utils,选定矩阵,进行Vertex Analysis,然后使用randomise命令进行多重比较(with multiple comparison correction),找到有显著差异的部分,可视化可以直接用fsleyes中的3Dview功能进行,也可以使用first3Dview。
具体可以参考Course:
http://fsl.fmrib.ox.ac.uk/fslcourse/lectures/practicals/seg_struc/index.html#first
# 我的理解是,该步骤把不同subject的bvars整合出来的文件,使用--useReconMNI参数,重构到MNI空间。Reconstructs the meshes in MNI space(native space of the model).
first_utils --usebvars --vertexAnalysis -i all.L_Caud.bvars -o design_F1_M2_L_Caud_mni -d design_F1_M2.mat --useReconMNI
# 在重构好的空间里,进行统计检验
randomise -i design_F1_M2_L_Caud_mni.nii.gz -m design_F1_M2_L_Caud_mni_mask.nii.gz -o F1_M2_L_Caud_rand -d design_F1_M2.mat -t design_F1_M2.con -f design_F1_M2.fts \
  --fonly -D -F 3
# 可视化有差异的地方(都在MNI152空间)
fsleyes -std1mm F1_M2_L_Caud_rand_clustere_corrp_fstat1 -cm red-yellow -dr 0.95 1 &

# 同样的,对于右尾状核也进行一样的操作,也没有看出来有差异
first_utils --usebvars --vertexAnalysis -i all.L_Caud.bvars -o design_F1_M2_L_Caud_mni -d design_F1_M2.mat --useReconMNI
randomise -i design_F1_M2_L_Caud_mni.nii.gz -m design_F1_M2_L_Caud_mni_mask.nii.gz -o F1_M2_L_Caud_rand -d design_F1_M2.mat -t design_F1_M2.con -f design_F1_M2.fts \
  --fonly -D -F 3
fsleyes -std1mm F1_M2_L_Caud_rand_clustere_corrp_fstat1 -cm red-yellow -dr 0.95 1 &
重点
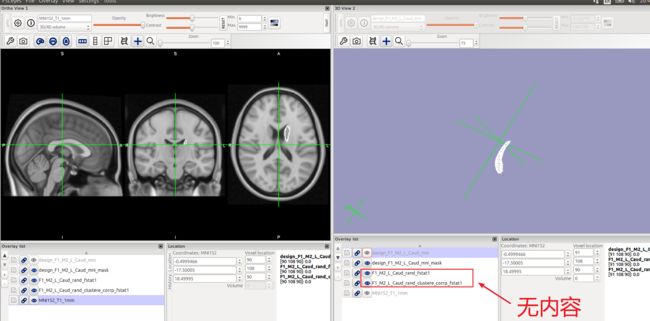
-dr LO HI, --displayRange LO HI 此处设置的范围是[0.95,1],图上无橘黄色,表示顶点分析无显著性的差异
如果将显示的范围调宽,则可以看出少部分不显著的差异地方,以下两图为同一位置:
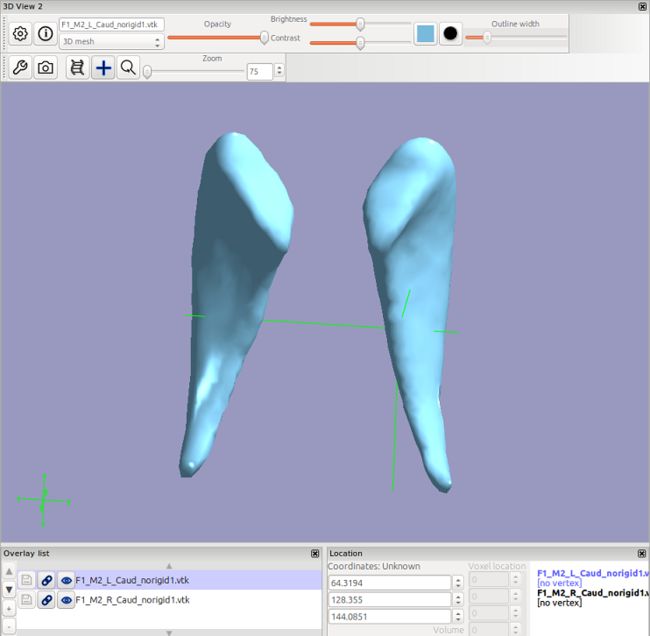
使用旧版方法检验(UserGuide不推荐),尝试了“使用useRigidAlign”和“不使用useRigidAlign”,surface_fdr也都没有检验出差异,即fdrmask,Fthresh,Fvals,pthresh,pvals都为空,
此处“数字医学研究中心”的学生也只是试了UserGuide里的方法,没有尝试fsl course里的东西,同样也只是得出空文件,大概就是没法检验出有统计性的结果。
具体代码如下:
first_utils --vertexAnalysis --surfaceout --usebvars -i all.L_Caud.bvars -d design_F1_M2.mat -o shape_analysis/F1_M2_L_Caud_rigid --useReconNative --useRigidAlign -v >& shape_analysis/F1_M2_L_Caud_rigid_output.txt
surface_fdr F1_M2_L_Caud_rigid1.vtk

first_utils --vertexAnalysis --surfaceout --usebvars -i all.L_Caud.bvars -d design_F1_M2.mat -o shape_analysis/F1_M2_L_Caud_norigid --useReconNative -v >& shape_analysis/F1_M2_L_Caud_norigid_output.txt
surface_fdr F1_M2_L_Caud_norigid1.vtk
3.6 Volumetric Analysis
对尾状核进行体积分析,同样使用xargs命令批量得到尾状核的体积。(-I {} 大括号指定替换的符号)
# Left-Caudate
ls *_fast_firstseg.nii.gz |xargs -I {} $FSLDIR/bin/fslstats {} -l 10.5 -u 11.5 -V
# Right-Caudate
ls *_fast_firstseg.nii.gz |xargs -I {} $FSLDIR/bin/fslstats {} -l 49.5 -u 50.5 -V
整理如下:
与使用matlab toolkit中CAT做出来的体积略有不同
| 病人编号 | 组织类别 | 像素数目 | 体积(立方毫米) | 体积(立方厘米) |
|---|---|---|---|---|
| CC0003 | 左尾状核 | 3463 | 2736.210945 | 2.736210945 |
| CC0003 | 右尾状核 | 3494 | 2760.704892 | 2.760704892 |
| CC0004 | 左尾状核 | 4586 | 3623.543375 | 3.623543375 |
| CC0004 | 右尾状核 | 4374 | 3456.035482 | 3.456035482 |
| CC0005 | 左尾状核 | 4461 | 3524.774828 | 3.524774828 |
| CC0005 | 右尾状核 | 4629 | 3657.516852 | 3.657516852 |
| CC0006 | 左尾状核 | 4029 | 3183.419978 | 3.183419978 |
| CC0006 | 右尾状核 | 3980 | 3144.703776 | 3.144703776 |
| CC0007 | 左尾状核 | 4612 | 3644.044224 | 3.644044224 |
| CC0007 | 右尾状核 | 4602 | 3636.143001 | 3.636143001 |
| CC0008 | 左尾状核 | 4214 | 3329.606493 | 3.329606493 |
| CC0008 | 右尾状核 | 4699 | 3712.81939 | 3.71281939 |
4 总结
4.1 信息汇总
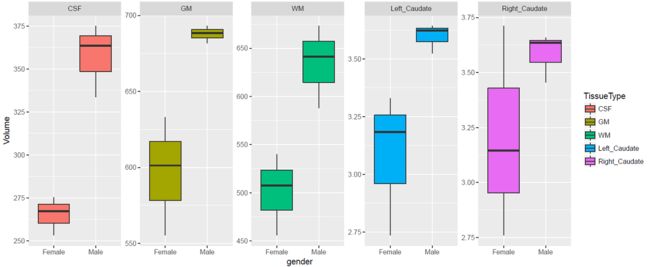
使用R语言和ggplot统计各组织的体积(单位:立方厘米),统计代码如下:
library(ggplot2)
setwd("C:/Users/83918/Desktop/BME_Homework")
Data <- read.table("C:/Users/83918/Desktop/BME_Homework/Volume.txt", head=T)
Data$TissueType <- factor(Data$TissueType, levels = c("CSF","GM","WM","Left_Caudate","Right_Caudate"))

Data[which(Data$PatientID=="CC0003"),"gender"] <- "Female"
Data[which(Data$PatientID=="CC0004"),"gender"] <- "Male"
Data[which(Data$PatientID=="CC0005"),"gender"] <- "Male"
Data[which(Data$PatientID=="CC0006"),"gender"] <- "Female"
Data[which(Data$PatientID=="CC0007"),"gender"] <- "Male"
Data[which(Data$PatientID=="CC0008"),"gender"] <- "Female"

ggplot(data=Data, aes(x=gender,y=Volume))+
  geom_boxplot(aes(fill=TissueType))+
  facet_wrap(~ TissueType,nrow = 1, ncol = 5, scales="free")
ggsave("volume.pdf",width = 8,height = 5)
汇总的表格如下:
| PatientID | TissueType | Volume |
|---|---|---|
| CC0003 | CSF | 275.2650464 |
| CC0003 | GM | 555.4275161 |
| CC0003 | WM | 455.9702629 |
| CC0004 | CSF | 375.1555599 |
| CC0004 | GM | 688.443591 |
| CC0004 | WM | 641.3323791 |
| CC0005 | CSF | 333.5685165 |
| CC0005 | GM | 693.2149998 |
| CC0005 | WM | 587.9127833 |
| CC0006 | CSF | 267.178115 |
| CC0006 | GM | 633.0859916 |
| CC0006 | WM | 539.7638088 |
| CC0007 | CSF | 363.5173308 |
| CC0007 | GM | 681.8345986 |
| CC0007 | WM | 673.3956282 |
| CC0008 | CSF | 253.2525779 |
| CC0008 | GM | 601.2856677 |
| CC0008 | WM | 507.58808 |
| CC0003 | Left_Caudate | 2.736210945 |
| CC0003 | Right_Caudate | 2.760704892 |
| CC0004 | Left_Caudate | 3.623543375 |
| CC0004 | Right_Caudate | 3.456035482 |
| CC0005 | Left_Caudate | 3.524774828 |
| CC0005 | Right_Caudate | 3.657516852 |
| CC0006 | Left_Caudate | 3.183419978 |
| CC0006 | Right_Caudate | 3.144703776 |
| CC0007 | Left_Caudate | 3.644044224 |
| CC0007 | Right_Caudate | 3.636143001 |
| CC0008 | Left_Caudate | 3.329606493 |
| CC0008 | Right_Caudate | 3.71281939 |
绘制出的统计图如下:
4.1 结论
作业数据中,三个男性的的白质,灰质,脑脊液,左右尾状核的体积都比三个女性要大得多,但是其尾状核的形状没有显著差异。
5 相关参考资料
- fsl UserGuide: https://fsl.fmrib.ox.ac.uk/fsl/fslwiki
- fsl课程ppt及练习数据: http://fsl.fmrib.ox.ac.uk/fslcourse/
- 注意看fsl课程practice相应html网页的时候,对照着网站上的ppt
官网说明的Labels如下:
- 10 Left-Thalamus-Proper 40
- 11 Left-Caudate 30
- 12 Left-Putamen 40
- 13 Left-Pallidum 40
- 16 Brain-Stem /4th Ventricle 40
- 17 Left-Hippocampus 30
- 18 Left-Amygdala 50
- 26 Left-Accumbens-area 50
- 49 Right-Thalamus-Proper 40
- 50 Right-Caudate 30
- 51 Right-Putamen 40
- 52 Right-Pallidum 40
- 53 Right-Hippocampus 30
- 54 Right-Amygdala 50
- 58 Right-Accumbens-area 50
