数据分析流程总结
数据采集和标记
爬虫
爬虫主要分为静态爬取和动态爬取,静态爬取的学习xpath就可以,也要掌握re的用法,因为一直要进行数据的清洗,动态爬取的话主要是要找到动态页面以及对应的参数传递,一般在netwoek---->Media中,还有一个要掌握selenium自动化技术,一般针对淘宝京东爬取。
静态爬取
xpath
在这里插入代码片
import requests
from lxml import etree
url='xxxxx'
start=requests.get(url).content.decode('utf-8','ignore')
ele=etree.HTML(start)
start_url=ele.xpath('//*[@id="content"]/div/ul/li/a/@href')
技巧总结
各行业小知识总结
库的小知识
## 去掉警告
import warnings
warnings.filterwarnings("ignore")
## 下载库
pip install keras -i http://pypi.douban.com/simple/ --trusted-host pypi.douban.com
数据读取
有时候数据量太大无法进行一次性获取,所以进行按行处理
data = []
with open('hotels_RoomPrice.csv', 'r',encoding='gbk',errors='ignore') as f:
    for line in f:
        data.append(line.split(','))

data = pd.DataFrame(data[0:100])
处理数据不平衡
from imblearn.over_sampling import SMOTE # 导入SMOTE算法模块
# 处理不平衡数据
sm = SMOTE(random_state=42)    # 处理过采样的方法
X, y = sm.fit_sample(X, y)
print('通过SMOTE方法平衡正负样本后')
n_sample = y.shape[0]
n_pos_sample = y[y == 0].shape[0]
n_neg_sample = y[y == 1].shape[0]
print('样本个数:{}; 正样本占{:.2%}; 负样本占{:.2%}'.format(n_sample,
                                                   n_pos_sample / n_sample,
                                                   n_neg_sample / n_sample))
数据清洗
通过Pandas的nunique方法来筛选属性分类为一的变量,剔除分类数量只有1的变量,Pandas方法nunique()返回的是变量的分类数量(除去非空值)
loans = test.loc[:,test.apply(pd.Series.nunique) != 1]
object值
##字符串转化
y_map = {'low': 2, 'medium': 1, 'high': 0}
train['interest_level'] = train['interest_level'].apply(lambda x: y_map[x])
#在实际模型建立中,训练集和测试集一般分开处理,如果直接使用分类处理,会导致新数据没有一个规定
#查看多少类变量
tab_1['字段'].unique()
def function(a):
	if '数值或字符'in a :
		return 1
	else:
		return 2
tab_1['结果'] = tab_1.apply(lambda x: function(x['结果']), axis = 1)
#有时还需用re统一规则
import re
def re_1(i):
    res=re.sub("[^a-zA-Z]", " ",i)
    return res
test_1['new_review'] = test_1.apply(lambda x: re_1(x['review']), axis = 1)
#需要加强一下re学习
#使用pandas库将类别变量编码
test_1 = pd.get_dummies(test_1)
#判断是否为object类型
cols = attrition.columns
for col in cols:
    if str(attrition[col].dtype) == 'object':
        categoricals.append(col)
#类别变量数量
housetype['装修情况'].value_counts()
-------------------------------------------
objectColumns = loans.select_dtypes(include=["object"]).columns
# 筛选数据类型为object的数据
loans[objectColumns] = loans[objectColumns].fillna("Unknown")
#以分类“Unknown”填充缺失值
-------------------------------------------
n_columns = ["home_ownership", "verification_status", "application_type","purpose", "term"]
dummy_df = pd.get_dummies(loans[n_columns])# 用get_dummies进行one hot编码
loans = pd.concat([loans, dummy_df], axis=1) #当axis = 1的时候,concat就是行对齐,然后将不同列名称的两张表合并
连续值
#标准化是通过特征的平均值和标准差将特征缩放成一个标准的正态分布,均值为0,方差为1
#将特征值缩放到相同区间可以使得获取性能更好的模型。就梯度下降算法而言,例如有两个不同的特征,第一个特征的取值范围为1~10,
#第二个特征的取值范围为1~10000。在梯度下降算法中,代价函数为最小平方误差函数,所以在使用梯度下降算法的时候,算法会明显的偏向于第二个特征,
#因为它的取值范围更大。在比如,k近邻算法,它使用的是欧式距离,也会导致其偏向于第二个特征。对于决策树和随机森林以及XGboost算法而言,
#特征缩放对于它们没有什么影响。
from sklearn.preprocessing import MinMaxScaler
from sklearn.preprocessing import StandardScaler
x = data["Alcohol"]
std = StandardScaler()
#将x进行标准化
x_std = std.fit_transform(x)
离散值
缺失值
#缺失值可以用不同的数填充  平均数 众数
#将均值填入
all_dummy_df.isnull().sum().sum()
mean_cols=all_dummy_df.mean()
all_dummy_df = all_dummy_df.fillna(mean_cols)
#将众数填入
all_dummy_df = all_dummy_df.fillna(数字)
#将缺失值比例列出
train_missing = (test_1.isnull().sum()/len(test_1))*100
train_missing = train_missing.drop(train_missing[train_missing==0].index).sort_values(ascending=False)
miss_data = pd.DataFrame({'缺失百分比':train_missing})
miss_data
#将缺失值直接删除
test_1.dropna(inplace=True)
## 使用随机森林填补一个特征的缺失值的函数
def fill_missing_rf(X,y,to_fill):

    """
    使用随机森林填补一个特征的缺失值的函数

    参数:
    X:要填补的特征矩阵
    y:完整的,没有缺失值的标签
    to_fill:字符串,要填补的那一列的名称
    """

    #构建我们的新特征矩阵和新标签
    df = X.copy()
    fill = df.loc[:,to_fill]
    df = pd.concat([df.loc[:,df.columns != to_fill],pd.DataFrame(y)],axis=1)

    # 找出我们的训练集和测试集
    Ytrain = fill[fill.notnull()]#特征不缺失的值
    Ytest = fill[fill.isnull()]#特征缺失的值
    Xtrain = df.iloc[Ytrain.index,:]#特征不缺失的值对应其他n-1个特征+本来的标签
    Xtest = df.iloc[Ytest.index,:]#特征缺失的值对应其他n-1个特征+本来的标签

    #用随机森林回归来填补缺失值
    from sklearn.ensemble import RandomForestRegressor as rfr
    rfr = rfr(n_estimators=100)
    rfr = rfr.fit(Xtrain, Ytrain)
    Ypredict = rfr.predict(Xtest)
    return Ypredict
#用随机森林填补比较多的缺失值
X = test.iloc[:,[5,0,1,2,3,4,6,7,8,9]]
y = test["SeriousDlqin2yrs"]#y = data.iloc[:,0]
X.shape#(149391, 10)
#=====[TIME WARNING:1 min]=====#
y_pred = fill_missing_rf(X,y,"MonthlyIncome")
#注意可以通过以下代码检验数据是否数量相同
y_pred.shape ==  test.loc[test.loc[:,"MonthlyIncome"].isnull(),"MonthlyIncome"].shape
#确认我们的结果合理之后,我们就可以将数据覆盖了
test.loc[test.loc[:,"MonthlyIncome"].isnull(),"MonthlyIncome"] = y_pred
test.info()
------------------------------------
# 设定阈值之后进行删除
thresh_count = len(data)*0.4 # 设定阀值
data = data.dropna(thresh=thresh_count, axis=1 ) #若某一列数据缺失的数量超过阀值就会被删除
异常值
#超过一定的值之后统一为国定的值
train_test['price'].ix[train_test['price']>13000] = 13000
# remove some noise
train_test.loc[train_test["bathrooms"] == 112, "bathrooms"] = 1.5
## 缺失值画箱型图
import seaborn as sns
data379=test[['NumberOfTime30-59DaysPastDueNotWorse','NumberOfTimes90DaysLate','NumberOfTime60-89DaysPastDueNotWorse']]
plt.clf()
plt.figure(figsize=(20,8))
data379.boxplot()
plt.xticks(rotation='90')
特征处理
特征衍生
特征抽象
特征缩放
特征缩放(peature scaling)是指将变量数据经过处理之后限定到一定的范围之内。特征缩放本质是一个去量纲的过程,同时可以加快算法收敛的速度。目前,将不同变量缩放到相同的区间有两个常用的方法:归一化(normalization)和标准化(standardization)。
col = loans.select_dtypes(include=['int64','float64']).columns
len(col)
out:78 #78个特征
col = col.drop('loan_status') #剔除目标变量
loans_ml_df = loans # 复制数据至变量loans_ml_df
###################################################################################
from sklearn.preprocessing import StandardScaler # 导入模块
sc =StandardScaler() # 初始化缩放器
loans_ml_df[col] =sc.fit_transform(loans_ml_df[col]) #对数据进行标准化
loans_ml_df.head() #查看经标准化后的数据
特征选择
过滤方法(filter approach): 通过自变量之间或自变量与目标变量之间的关联关系选择特征。
正常情况下,影响目标变量的因数是多元性的;但不同因数之间会互相影响(共线性 ),或相重叠,进而影响到统计结果的真实性。下一步,我们在第一次降维的基础上,通过皮尔森相关性图谱找出冗余特征并将其剔除;同时,可以通过相关性图谱进一步引导我们选择特征的方向。
colormap = plt.cm.viridis
plt.figure(figsize=(12,12))
plt.title('Pearson Correlation of Features', y=1.05, size=15)
sns.heatmap(loans_ml_df[col_filter].corr(),linewidths=0.1,vmax=1.0, square=True, cmap=colormap, linecolor='white', annot=True)
嵌入方法(embedded approach): 通过学习器自身自动选择特征。
很多时候我们需要了解每个特征对目标的影响程度,在特定的业务场景下,不同的特征权重对业务的决策带来不同的影响。例如,在Lending Club的业务数据中,能够反映借款人资产状况或现金流的特征都对我们构建预测违约贷款模型十分关键。因此,我们需要对特征的权重有一个正确的评判和排序,就可以通过特征重要性排序来挖掘哪些变量是比较重要的,降低学习难度,最终达到优化模型计算的目的。这里,我们采用的是随机森林算法判定特征的重要性
names = loans_ml_df[col_new].columns
from sklearn.ensemble import RandomForestClassifier
clf=RandomForestClassifier(n_estimators=10,random_state=123)#构建分类随机森林分类器
clf.fit(x_val[col_new], y_val) #对自变量和因变量进行拟合
names, clf.feature_importances_
for feature in zip(names, clf.feature_importances_):
    print(feature)
    plt.style.use('fivethirtyeight')
plt.rcParams['figure.figsize'] = (12,6)

## feature importances 可视化##
importances = clf.feature_importances_
feat_names = names
indices = np.argsort(importances)[::-1]
fig = plt.figure(figsize=(20,6))
plt.title("Feature importances by RandomTreeClassifier")
plt.bar(range(len(indices)), importances[indices], color='lightblue',  align="center")
plt.step(range(len(indices)), np.cumsum(importances[indices]), where='mid', label='Cumulative')
plt.xticks(range(len(indices)), feat_names[indices], rotation='vertical',fontsize=14)
plt.xlim([-1, len(indices)])
plt.show()
包装方法(wrapper approacch): 通过目标函数(AUC/MSE)来决定是否加入一个变量。
首先,选出与目标变量相关性较高的特征。这里采用的是Wrapper方法,通过暴力的递归特征消除 (Recursive Feature Elimination)方法筛选30个与目标变量相关性最强的特征,逐步剔除特征从而达到首次降维,自变量从104个降到30个。
from sklearn.feature_selection import RFE
from sklearn.linear_model import LogisticRegression
# 建立逻辑回归分类器
model = LogisticRegression()
# 建立递归特征消除筛选器
rfe = RFE(model, 30) #通过递归选择特征,选择30个特征
rfe = rfe.fit(x_val, y_val)
# 打印筛选结果
print(rfe.support_)
print(rfe.ranking_) #ranking 为 1代表被选中,其他则未被代表未被选中
时间序列
rng = pd.period_range('1/1/2017','2/28/2019',freq='M') #创建从2001-01-01到2000-06-30所有月份的Period
data_1=pd.Series(np.random.randn(len(rng)),index=rng)
df=pd.DataFrame({"data" :data_1,"企业编号":4001})
df.drop('data',inplace=True,axis=1)
df.head()
————————————————————————————————————————————————————
#转化为时间段进行处理
df['时间'] = df['时间'].apply(lambda x: pd.Timestamp(x))
# 年份
df['年']=df['时间'].apply(lambda x: x.year)

# 月份
df['月']=df['时间'].apply(lambda x: x.month)

# 日
df['日']=df['时间'].apply(lambda x: x.day)

# 小时
df['时']=df['时间'].apply(lambda x: x.hour)

# 分钟
df['分']=df['时间'].apply(lambda x: x.minute)

# 秒数
df['秒']=df['时间'].apply(lambda x: x.second)

# 一天中的第几分钟
df['一天中的第几分钟']=df['时间'].apply(lambda x: x.minute + x.hour*60)

# 星期几;
df['星期几']=df['时间'].apply(lambda x: x.dayofweek)

# 一年中的第几天
df['一年中的第几天']=df['时间'].apply(lambda x: x.dayofyear)

# 一年中的第几周
df['一年中的第几周']=df['时间'].apply(lambda x: x.week)

# 一天中哪个时间段:凌晨、早晨、上午、中午、下午、傍晚、晚上、深夜;
period_dict ={
    23: '深夜', 0: '深夜', 1: '深夜',
    2: '凌晨', 3: '凌晨', 4: '凌晨',
    5: '早晨', 6: '早晨', 7: '早晨',
    8: '上午', 9: '上午', 10: '上午', 11: '上午',
    12: '中午', 13: '中午',
    14: '下午', 15: '下午', 16: '下午', 17: '下午',
    18: '傍晚',
    19: '晚上', 20: '晚上', 21: '晚上', 22: '晚上',
}
df['时间段']=df['时'].map(period_dict)

# 一年中的哪个季度
season_dict = {
    1: '春季', 2: '春季', 3: '春季',
    4: '夏季', 5: '夏季', 6: '夏季',
    7: '秋季', 8: '秋季', 9: '秋季',
    10: '冬季', 11: '冬季', 12: '冬季',
}
df['季节']=df['月'].map(season_dict)
数据划分
rom sklearn.model_selection import train_test_split
# 使用train_test_split方法,划分训练集和测试集,指定80%数据为训练集,20%为验证集
X_train, X_test, y_train, y_test = train_test_split(X,y, test_size=0.2,random_state=2020)
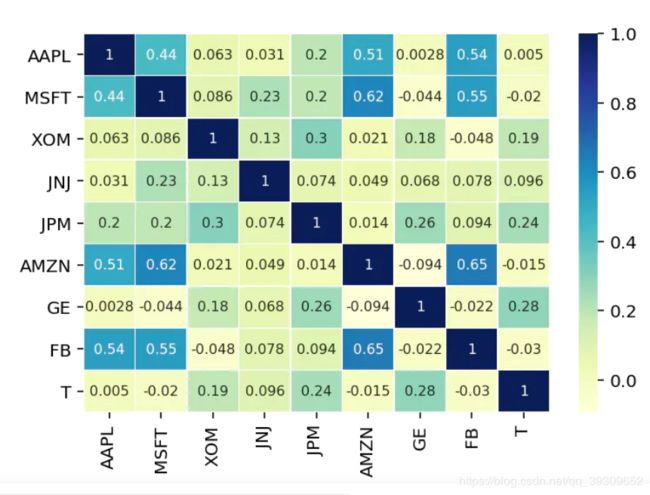
相关性分析
#导入seaborn
import seaborn as sns
import matplotlib.pyplot as plt
%matplotlib inline
#创建热图
correlation_matrix=test.corr()
sns.heatmap(correlation_matrix,
            annot=True,
            cmap="YlGnBu",
            linewidths=0.3,
            annot_kws={"size": 8})

plt.xticks(rotation=90)
plt.yticks(rotation=0)
plt.show()
绘图
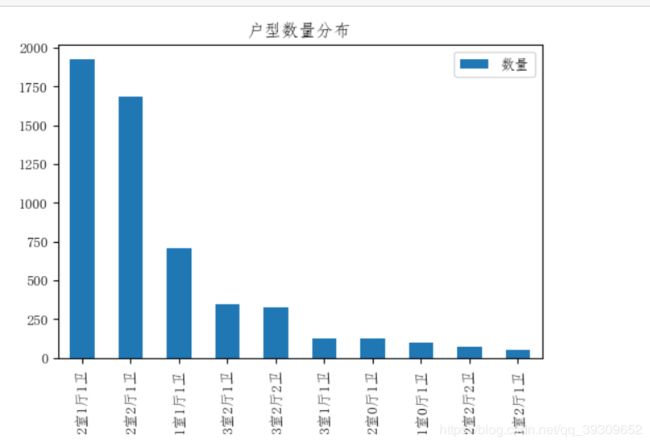
直方图
plt.figure(figsize=(10,5))#改变图形大小
from pylab import mpl
mpl.rcParams['font.sans-serif'] = ['FangSong'] # 指定默认字体
mpl.rcParams['axes.unicode_minus'] = False # 解决保存图像是负号'-'显示为方块的问题
#设置画布
asd,sdf = plt.subplots(1,1,dpi=100)
#获取排前10条类型
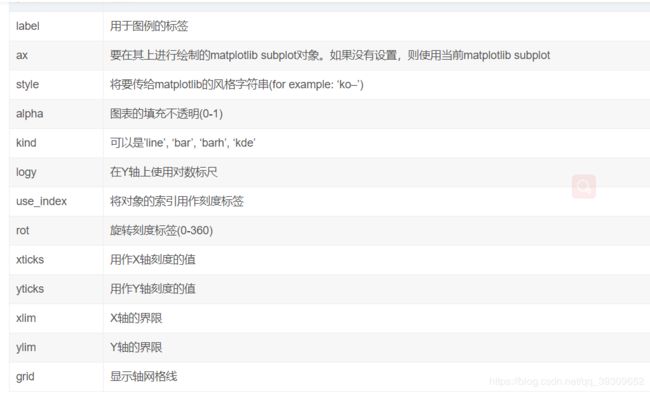
housetype.head(10).plot(kind='bar',x='housetype',y='size',title='户型数量分布',ax=sdf)
plt.legend(['数量'])
plt.show()
散点图
plt.clf()
fig,axs=plt.subplots(1,2,figsize=(14,4))
axs[0].scatter(x=test_all.loc[:,'面积'],y=test_all.loc[:,'价格'])
axs[1].scatter(x=test_all[test_all.loc[:,'面积']<175].loc[:,'面积'],y=test_all[test_all.loc[:,'面积']<175].loc[:,'价格'])
plt.show()
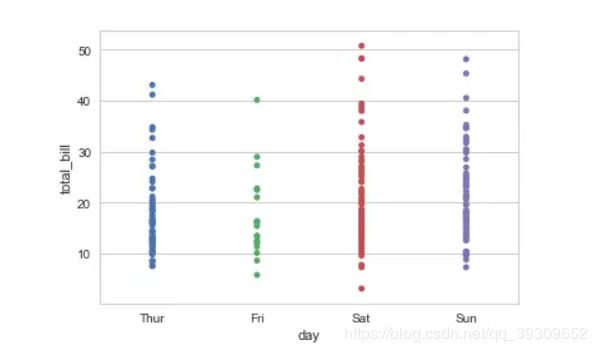
分类变量画图
import seaborn as sns
sns.stripplot(x="day", y="total_bill", data=tips);
特征选择
选取贡献度超过95%的特征
from sklearn.feature_selection import SelectKBest
selector = SelectKBest(k=2)
X_new = selector.fit_transform(X, Y)
kfold = KFold(n_splits=10)
cv_result = cross_val_score(model, X_new, Y, cv=kfold)
分析各特征关系
contFeatureslist = []
contFeatureslist.append("bathrooms")
contFeatureslist.append("bedrooms")
contFeatureslist.append("price")
correlationMatrix = train[contFeatureslist].corr().abs()
plt.subplots(figsize=(13, 9))
sns.heatmap(correlationMatrix,annot=True)
# Mask unimportant features
sns.heatmap(correlationMatrix, mask=correlationMatrix < 1, cbar=False)
plt.show()
模型选择
如何选择模型
#多个模型
models = []
models.append(("KNN", KNeighborsClassifier(n_neighbors=2)))
models.append(("KNN with weights", KNeighborsClassifier(
    n_neighbors=2, weights="distance")))
models.append(("Radius Neighbors", RadiusNeighborsClassifier(
    n_neighbors=2, radius=500.0)))
results = []
for name, model in models:
    model.fit(X_train, Y_train)
    results.append((name, model.score(X_test, Y_test)))
for i in range(len(results)):
    print("name: {}; score: {}".format(results[i][0],results[i][1]))
分类模型
随机森林
from sklearn.ensemble import RandomForestClassifier
# SVC(C=1.0, kernel='rbf', gamma=0.1)
clf =RandomForestClassifier() # 定义随机森林模型
# 拟合模型
clf.fit(x_train, y_train)
y_predict=clf.predict(x_test)
print(classification_report(y_test, y_predict))
回归模型
k-近邻算法
线性回归算法
from sklearn.datasets import load_boston
from sklearn.linear_model import LinearRegression
lineR = LinearRegression()
lineR.fit(X_train,y_train)
train_score = lineR.score(X_test,y_test)
print(train_score)
逻辑回归算法
决策树
支持向量机
朴素贝叶斯
pca算法
k-均值算法
xgboost
import xgboost as xgb
pipes =Pipeline([
            ('xgb', xgb.XGBRegressor())
        ])
parameters = [
    {
    "xgb__n_estimators":[100,200,300,500,1000]
    }
]
#获取数据
x_train2, x_test2, y_train2, y_test2 = X_train, X_test, y_train, y_test
gscv = GridSearchCV(pipes, param_grid=parameters)
gscv.fit(x_train2, y_train2)
print ("score值:",gscv.best_score_,"最优参数列表:", gscv.best_params_)
随机森林
# #参数优化
from sklearn.pipeline import Pipeline #管道
from sklearn.model_selection import GridSearchCV #网格搜索交叉验证,用于选择最优的参数
from sklearn.ensemble import RandomForestRegressor
pipes =Pipeline([
            ('RandomForestClassifier', RandomForestRegressor(criterion='mse'))
        ])
# 参数
#
# estimators = [1,50,100,500]
# depth = [1,2,3,7,15]
parameters = [
    {
    "RandomForestClassifier__n_estimators":[1,50,100,500,1000,3000],
    "RandomForestClassifier__max_depth":[1,2,3,7,15]
    }
]
#获取数据
x_train2, x_test2, y_train2, y_test2 = X_train, X_test, y_train, y_test
gscv = GridSearchCV(pipes, param_grid=parameters)
gscv.fit(x_train2, y_train2)
print ("score值:",gscv.best_score_,"最优参数列表:", gscv.best_params_)
模型训练和测试
参数调节
模型性能评估和优化
准确度
from sklearn.metrics import explained_variance_score
print('准确率:',explained_variance_score(y_test,final))
查准率和召回率
模型使用
模型的保存


