Python学习——K-means聚类
K-means的用法
有了Python真的是做什么都方便得很,我们只要知道我们想要用的算法在哪个包中,我们如何去调用就ok了~~
首先,K-means在sklearn.cluster中,我们用到K-means聚类时,我们只需:
from sklearn.cluster import KMeans
K-means在Python的三方库中的定义是这样的:
class sklearn.cluster.KMeans(n_clusters=8, init=’k-means++’, n_init=10, max_iter=300, tol=0.0001, precompute_distances=’auto’, verbose=0, random_state=None, copy_x=True, n_jobs=None, algorithm=’auto’)
各输入参数的含义
n_clusters : int, optional, default: 8
表示的是要生成的簇的数量,或者说聚类中心的数量。是个整型的数,默认值为8;
init : {‘k-means++’, ‘random’ or an ndarray}
表示的是对需要聚类的数据的初始化的方法,默认的方法是’k-means++’.
初始化的方法有三种:k-means++,random,或者是一个数组。
k-means++能智能的选择初始聚类中心进行k均值聚类,加快收敛速度。
random则是从数据中随机的选择k个观测值作为初始的聚类中心。
也可以传递给init一个数组作为初始化的聚类中心,则这个数组的结构应该是(n_clusters, n_features)。
n_init : int, default: 10
表示的是K-means算法选择聚类中心的次数,默认值为10。最终返回的是聚类中心最好的一次结果(好是指时间的长短)。
max_iter : int, default: 300
每次运行K-means算法的最大迭代次数,默认值为300.
tol : float, default: 1e-4
表示的相当于是迭代终止的精度要求,可以允许的误差,当满足这个精度,则聚类收敛,寻找到最优解,可以停止迭代,默认值为10-4。
precompute_distances : {‘auto’, True, False}
预先计算距离,在空间和时间上作出权衡。这样做会更快,但是会占用更多的内存,默认值为‘auto’。
‘auto’指如果n_samples * n_clusters > 12亿时,就不预先计算距离。这样就相当于使用双精度的每个作业大约需要100MB的内存。
‘True’指总是预先计算距离。
‘False’指不预先计算距离。
verbose : int, default 0
是否输出详细信息,默认值为0。
random_state : int, RandomState instance or None (default)
确定聚类中心初始化的随机数生成。使用一个整型的数是的随机性具有确定性,默认值为None。
copy_x : boolean, optional
bool 在scikit-learn 很多接口中都会有这个参数的,就是是否对输入数据继续copy 操作,以便不修改用户的输入数据,默认值为True。为True时,是不修改原始数据,确保X是C-contiguous,聚类后不修改原始数据。为False时,则修改原始数据,在函数返回之前将修改后的放回X,但通过减去再加上数据均值,可能会引入较小的数值差异,在这种情况下,也不能保证数据是C-contiguous,可能会使速度明显的下降。
n_jobs : int or None, optional (default=None)
使用进程的数量,与电脑CPU有关。默认值为None。
algorithm : “auto”, “full” or “elkan”, default=“auto”
K-means算法所用到的,“full”指经典的EM-style算法;“elkan”通过使用三角不等式,所以更高效,但目前不支持稀疏的数据;“auto”则在数据密集时,选择“elkan”,在数据稀疏时,选择“full”。
函数返回值
**cluster_centers_:**聚类中心的坐标。
如果算法还未完全收敛就停止,则将与labels_不一致。
**labels_:**每个点的标签。
**inertia_:**样本到聚类中心的平方和。
**n_iter_:**迭代运行的次数。
方法
| 函数 | 功能 |
|---|---|
| fit(X[, y, sample_weight]) | 计算K-means聚类 |
| fit_predict(X[, y, sample_weight]) | 计算每个样本的集群中心并预测簇索引。 |
| fit_transform(X[, y, sample_weight]) | 计算聚类并将X变换为聚类距离空间。 |
| get_params([deep]) | 获取此估计函数的参数。 |
| predict(X[, sample_weight]) | 预测X中每个样本所属的最近簇。 |
| score(X[, y, sample_weight]) | 与k -均值目标上的X值相反。 |
| set_params(**params) | 设置此估计函数的参数。 |
| transform(X) | 将X变换为一个簇距空间。 |
示例
示例一:
from sklearn.cluster import KMeans
import numpy as np

# 构造数据样本点集X,并计算K-means聚类
X = np.array([[1, 2], [1, 4], [1, 0], [4, 2], [4, 4], [4, 0]])
kmeans = KMeans(n_clusters=2, random_state=0).fit(X)

# 输出及聚类后的每个样本点的标签(即类别),预测新的样本点所属类别
print(kmeans.labels_)
print(kmeans.predict([[0, 0], [4, 4], [2, 1]]))
输出结果为:
[0 0 0 1 1 1]
[0 1 0]
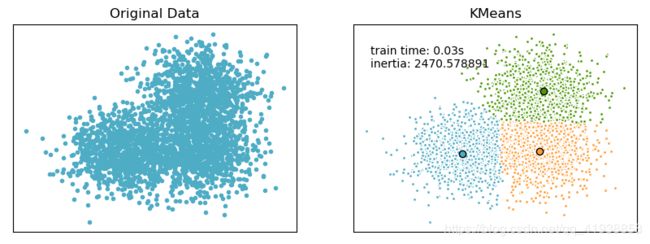
示例二:
import time
import numpy as np
import matplotlib.pyplot as plt

from sklearn.cluster import KMeans
from sklearn.metrics.pairwise import pairwise_distances_argmin
from sklearn.datasets.samples_generator import make_blobs

# ######################################
# Generate sample data
np.random.seed(0)

batch_size = 45
centers = [[1, 1], [-1, -1], [1, -1]]
n_clusters = len(centers)
X, labels_true = make_blobs(n_samples=3000, centers=centers, cluster_std=0.7)

# plot result
fig = plt.figure(figsize=(8,3))
fig.subplots_adjust(left=0.02, right=0.98, bottom=0.05, top=0.9)
colors = ['#4EACC5', '#FF9C34', '#4E9A06']

# original data
ax = fig.add_subplot(1,2,1)
row, _ = np.shape(X)
for i in range(row):
    ax.plot(X[i, 0], X[i, 1], '#4EACC5', marker='.')

ax.set_title('Original Data')
ax.set_xticks(())
ax.set_yticks(())

# compute clustering with K-Means
k_means = KMeans(init='k-means++', n_clusters=3, n_init=10)
t0 = time.time()
k_means.fit(X)
t_batch = time.time() - t0

k_means_cluster_centers = np.sort(k_means.cluster_centers_, axis=0)
k_means_labels = pairwise_distances_argmin(X, k_means_cluster_centers)

# K-means
ax = fig.add_subplot(1, 2, 2)
for k, col in zip(range(n_clusters), colors):
    my_members = k_means_labels == k		# my_members是布尔型的数组(用于筛选同类的点,用不同颜色表示)
    cluster_center = k_means_cluster_centers[k]
    ax.plot(X[my_members, 0], X[my_members, 1], 'w',
            markerfacecolor=col, marker='.')	# 将同一类的点表示出来
    ax.plot(cluster_center[0], cluster_center[1], 'o', markerfacecolor=col,
            markeredgecolor='k', marker='o')	# 将聚类中心单独表示出来
ax.set_title('KMeans')
ax.set_xticks(())
ax.set_yticks(())
plt.text(-3.5, 1.8, 'train time: %.2fs\ninertia: %f' % (t_batch, k_means.inertia_))

plt.show()
运行结果为: