第四篇-MATLAB图形可视化(三)
目录
- 5.特殊图像绘制
- 5.1 面积图area
- 5.2直方图bar
- 5.3饼图pie
- 6.极坐标、柱坐标和球坐标系下绘制图形
- 6.1极坐标系
- 7.坐标轴的调整和图像标注
- 7.1坐标轴调整命令
- 7.2图形标注
- 7.2.1坐标轴和图像标题标注
- 7.2.2图例的标注
- 7.2.3控制分格线
- 结尾的话
5.特殊图像绘制
5.1 面积图area
- 表现各个不同部分对整体所作的贡献
- 命令格式:
- area(X,Y):与 plot 的命令的使用方法相似,将连线图 到 x 轴的那部分填上了颜色;
- area(Y):缺省值 X=1:SIZE(Y);
- area(X,Y,LEVEL)或 area(Y,LEVEL):填色部分为由连 线图到 y=level 的水平线之间的部分。
- 示例:
X=-2:2;
Y=[3,5,2,4,1;5,4,2,3,5;3,4,5,2,1];
area(X',Y')
legend('因素 1','因素 2','因素 3')
grid on
5.2直方图bar
- 直方图常用于统计数据的作图, 有bar、bar3、barh 和 bar3h几种函数,其调用格式类似。
- 命令格式:
- bar(X,Y):X 是横坐标向量,Y 可以是向量或矩阵。Y 是向量时,每 一个元素对应一个竖条;Y 是 m 行 n 列矩阵时,将画出 m 组竖条, 每组包括 n 个竖条;
- bar(Y):横坐标使用缺省值 X=1:M;
- bar(X,Y,WIDTH) 或 bar(Y,WIDTH):用 WIDTH 指定竖条的宽度, 如果 WIDTH>1,条与条之间将重合。缺省宽度为 0.8;
- bar(…,’grouped’):产生缺省的组合直方图;
- bar(…,’stacked’):产生累积的直方图;
- bar(…,linespec):指定条的颜色;
- H = bar(…):返回条形图对象的句柄。
- 示例:
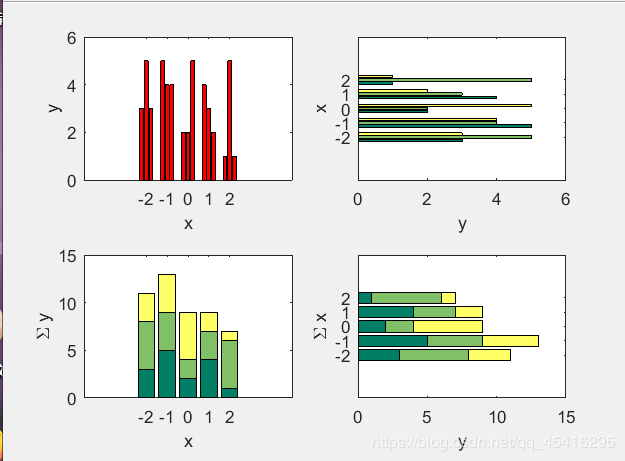
X=-2:2;
Y=[3,5,2,4,1;5,4,2,3,5;3,4,5,2,1];
subplot(2,2,1)
bar(X,Y','r')
xlabel('x')
ylabel('y')
colormap(cool)
subplot(2,2,2)
barh(X,Y','grouped')
xlabel('y')
ylabel('x')
colormap(cool)
subplot(2,2,3)
bar(X,Y','stacked')
xlabel('x')
ylabel('\Sigma y')
colormap(summer)
subplot(2,2,4)
barh(X,Y','stacked')
xlabel('y');
ylabel('\Sigma x')
colormap(summer)
5.3饼图pie
- 饼图又叫扇形图,用于显示向量中元素所占向量元素总和 的百分比。 pie 和 pie3分别用于绘制二维和三维饼图。
- 命令格式:
- pie(X):向量 X 的饼图。把 X 的每一个元素在所有元 素总和中占的比例表达出来;
- pie(X,EXPLODE):向量EXPLODE(和向量X长度相 等)用于指定饼图中抽出一部分的块(非零值对应的块);
- pie(…,LABELS):LABELS 是用于标注饼图的字符串数 组,其长度必须和向量 X相等;
- H = pie(…):返回包括饼图和文本对象句柄。
x=[200,360,120,400,320];

subplot(2,2,1);
pie(x,[0 0 0 1 0])

subplot(2,2,2),;
pie3(x,[0 0 0 1 0])

subplot(2,2,3);
pie(x(2:5))

subplot(2,2,4)
x=[0.1,0.12,0.21,0.34,0.11];
pie3(x ,{'A','B','C','D','E'})
6.极坐标、柱坐标和球坐标系下绘制图形
6.1极坐标系
- ploar是直接在极坐标系下绘图的命令
- 命令格式: ploar(THETA, RHO,S) ,其中 S 是字符串,用来控制图形的线型。
- 示例:
rhe=2;
theta=0:pi/20:4*pi;
rho=rhe+theta*rhe;
polar(theta,rho,'r')
7.坐标轴的调整和图像标注
7.1坐标轴调整命令
| 命令格式 | 功能 |
|---|---|
| axis auto | 坐标轴取默认值 |
| axis manual | 冻结坐标轴,保持坐标轴取值范围不变 |
| axis tight | 将在三个方向上的纵高比设为一个值 |
| axis fill | 坐标轴取值范围设为绘图所用数据在相应方向上的最大,最小值 |
| axis ij | 将二维图形的坐标原点设置在图形左上角,i轴垂直向下,j轴水平向右 |
| axis xy | 二维图形坐标轴恢复为系统默认状态 |
| axis equal | 使坐标轴在三个方向上的刻度增量相同 |
| axis image | 与axis on 相同 |
| axis square | 坐标轴在三个方向上的长度相等 |
| axis normal | 撤销命令axis equal 与 axis vis3d的操作 |
| axis vis3d | 冻结坐标系状态,以便旋转 |
| axis off | 坐标轴消隐 |
| axis on | 恢复消隐的坐标轴 |
7.2图形标注
7.2.1坐标轴和图像标题标注
- 标注坐标轴 x、y 和 z 的命令函数为 xlabel、ylabel 和 zlabel 。
- 命令格式:
- xlabel(’text’)
- xlabel(’text’,’Property1’,PropertyValue1,’Property2’,Prope rtyValue2,…)
- H = xlabel(…) 返回坐标轴标注的句柄。
- 其中,’text’是要添加的标注文本。’Property’是文本的 属性名,’PropertyValue’是属性值(所用字体、大小、标 注角度等)。
- 图形加标题的函数为 title,其调用格式与坐标轴标注类似。
7.2.2图例的标注
- legend命令实现不同图例的说明。其调用格式为:
- legend(string1,string2,string3, …)
- legend(string1,string2,string3,…,Pos)
- 按顺序把字符串添加到相应的曲线线型符号之后;Pos对图 例的位置作出设置和调整:
- 0 = 自动把图例置于最佳位置( 和图中曲线重复最少);
- 1 = 置于图形窗口的右上角( 缺省值);
- 2 = 置于图形窗口的左上角;
- 3 = 置于图形窗口的左下角;
- 4 = 置于图形窗口的右下角;
- 1 = 置于图形窗口的右侧( 外部)。
7.2.3控制分格线
- grid on:打开分格线控制开关,以后绘制的图形都带 有分格线;
- grid off:关闭分格线控制开关,以后绘制的图形都不 带分格线;
- grid:用于实现分格线绘制切换。
t=0:0.1:4*pi;
y=sin(t);
y1=cos(t);
plot(t,y,':',t,y1,'r*')
xlabel('x 轴  (0--4\pi)','fontsize',12,'fontweight','bold')
ylabel('y 轴','fontsize',12,'fontweight','bold')
title('绘制正弦波和余弦波 Pos=1','fontsize',10,'fontweight','bold','fontangle','italic')
text(pi,0,'\leftarrowsin(\pi)=0')
text(pi,-1,'\leftarrowcos(\pi)=-1')
text(pi/2,0.9,['\uparrowsin(\pi/2)=',num2str(sin(pi/2))])
text(0,-0.6,['绘图日期:',date])
text(0,-0.8,['MATLAB 版本:',version])
legend('正弦波','余弦波')
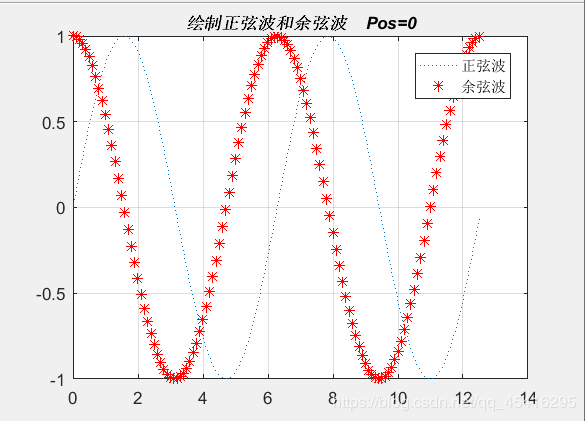
figure(2)
plot(t,y,':',t,y1,'r*')
title('绘制正弦波和余弦波    Pos=0','fontsize',10,'fontweight','bold','fontangle','italic')
legend('正弦波','余弦波',0)
grid on
figure(3)
plot(t,y,':',t,y1,'r*')
title('绘制正弦波和余弦波  Pos=-1','fontsize',10,'fontweight','bold','fontangle','italic')
text(7*pi/2,0,'\rightarrowcos(\pi*7/2)=0')
legend('正弦波','余弦波',-1)
grid off
结尾的话
MATLAB图形可视化的学习就到这儿,如有写作错误,不吝赐教。


