时间序列的7种预测模型
背景
时间序列问题比较常见,比如股市,工业生产指标等。
导入必要的包:
from statsmodels.tsa.api import ExponentialSmoothing, \
SimpleExpSmoothing, Holt

import statsmodels.api as sm
1 朴素估计
y ^ t + 1 = y t \hat{y}_{\mathrm{t}+1}=\mathrm{y}_{\mathrm{t}} y^t+1=yt
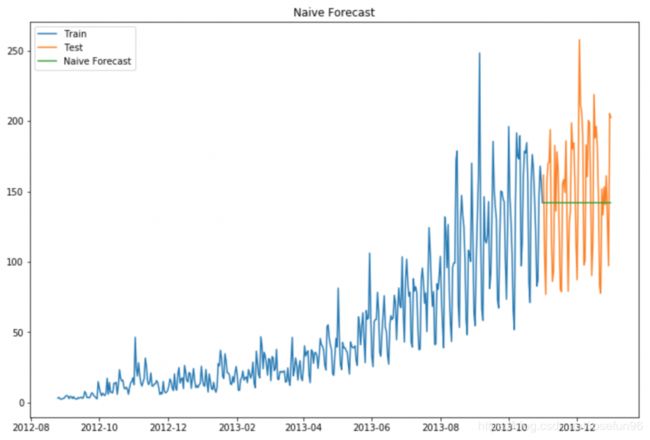
使用最后一个时间点的值估测后面一段时间段的值。
dd= np.asarray(train.Count)
y_hat = test.copy()
y_hat['naive'] = dd[len(dd)-1]
2 简单平均
y_hat_avg = test.copy()
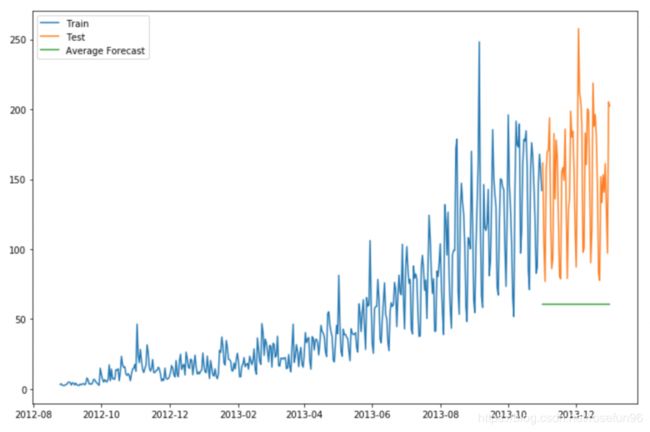
y_hat_avg['avg_forecast'] = train['Count'].mean()
4 滑动窗平均

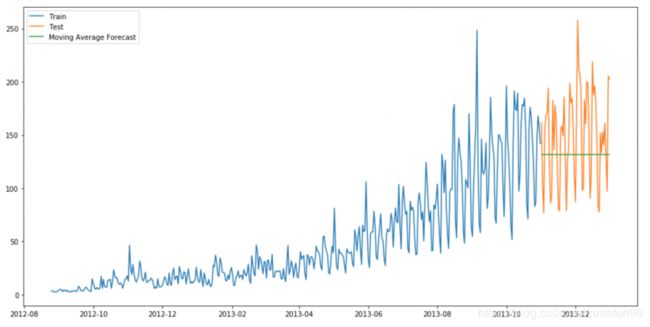
使用之前一定大小时间段的平均值作为这个时间点的值。
或者使用加权的滑动窗平均:

y_hat_avg = test.copy()
y_hat_avg['moving_avg_forecast'] = train['Count'].rolling(60).mean().iloc[-1]
5 简单指数平滑

where 0≤ α ≤1 is the smoothing parameter.
如果时间序列很长,可以看作:

from statsmodels.tsa.api import ExponentialSmoothing, \
SimpleExpSmoothing, Holt
y_hat_avg = test.copy()
fit2 = SimpleExpSmoothing(np.asarray(train['Count'])).fit(
smoothing_level=0.6,optimized=False)
y_hat_avg['SES'] = fit2.forecast(len(test))
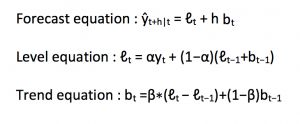
5 Holt’s线性趋势方法
主要考虑趋势。
import statsmodels.api as sm
sm.tsa.seasonal_decompose(train.Count).plot()
result = sm.tsa.stattools.adfuller(train.Count)
7 Holt-winters 方法
这种思想比较简单有效,假设数据服从两点,
1.数据是呈递增、递减趋势的;
2.数据服从一个周期变化。
然后,对残差,再进行其他方式的拟合,比如三次样条曲线。
y_hat_avg = test.copy()
fit1 = ExponentialSmoothing(np.asarray(train['Count']) ,
seasonal_periods=7 ,trend='add', seasonal='add',).fit()
y_hat_avg['Holt_Winter'] = fit1.forecast(len(test))
8 Arima方法
ARIMA模型(Autoregressive Integrated Moving Average model)整合移动平均自回归模型。
ARIMA(p,d,q)模型:
ARIMA(p, d, q) 由三个部分组成:
- AR§:AR是autoregressive的缩写,表示自回归模型,含义是当前时间点的值等于过去若干个时间点的值的回归——因为不依赖于别的解释变量,只依赖于自己过去的历史值,故称为自回归;如果依赖过去最近的p个历史值,称阶数为p,记为
AR(p)模型。 - I(d):I是integrated的缩写,含义是模型对时间序列进行了差分;因为时间序列分析要求平稳性,不平稳的序列需要通过一定手段转化为平稳序列,一般采用的手段是差分;d表示差分的阶数,t时刻的值减去t-1时刻的值,得到新的时间序列称为1阶差分序列;1阶差分序列的1阶差分序列称为2阶差分序列,以此类推;另外,还有一种特殊的差分是季节性差分S,即一些时间序列反应出一定的周期T,让t时刻的值减去t-T时刻的值得到季节性差分序列。
- MA(q):MA是moving average的缩写,表示移动平均模型,含义是当前时间点的值等于过去若干个时间点的预测误差的回归;预测误差=模型预测值-真实值;如果序列依赖过去最近的q个历史预测误差值,称阶数为q,记为
MA(q)模型。
y_hat_avg = test.copy()
fit1 = sm.tsa.statespace.SARIMAX(train.Count, order=(2, 1,
4),seasonal_order=(0,1,1,7)).fit()
y_hat_avg['SARIMA'] = fit1.predict(start="2013-11-1",
end="2013-12-31", dynamic=True)
9. PROPHET 方法
Facebook提出的一种方法,与Holt-winters类似,主要想法是"
时间序列的分解(Decomposition of Time Series),它把时间序列 分成几个部分,分别是季节项 ,趋势项 ,剩余项,与Holt-winters方法类似 。
fbprophet的安装依赖Pystan.
reference:
- analytics : Time-series forecast;
- 知乎 arima详解;
- Forecasting at Scale Facebook;
- Wiki Arima;
- ARIMA模型详解;
- Fbprophet 使用官网;


