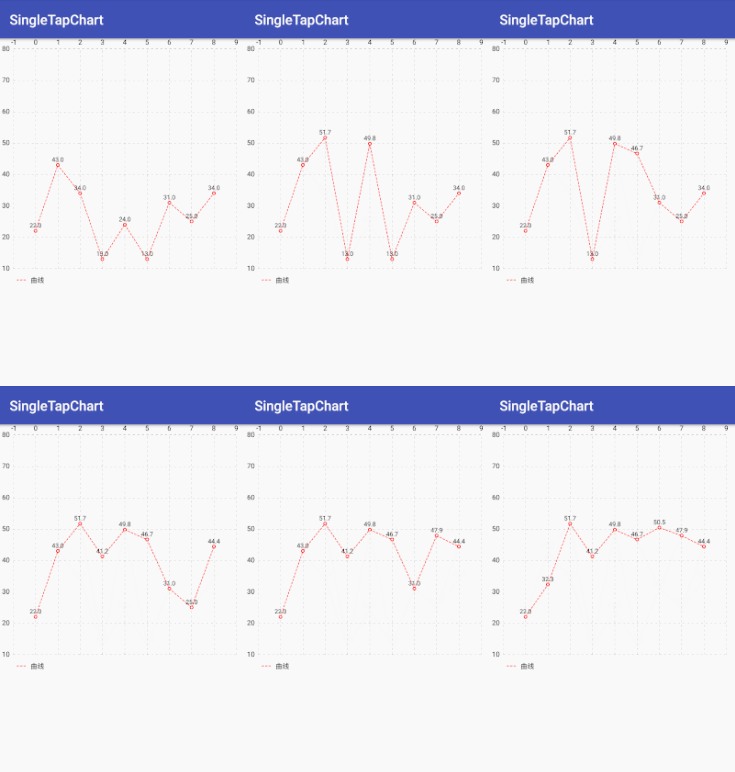
上一篇文章基于MPAndroidChart的自定义LineChart(一)----节点绘制叉号+分段绘制背景中添加了节点绘制叉号+分段绘制背景的功能,这篇文章继续改造,给MPAndroidChart的LineChart单击事件做一些处理,让图表能跟响应单击操作,改变数据重绘图表。
效果如下:
功能实现
由于MPAndroiChart只支持缩放、拖动(平移)、选择等手势,但这些手图表的数据没有什么改变,如果我们需要在图标上根据手势修改数据,继而重绘图表,就需要自己处理了。好在MPAndroiChart为我们提供了OnChartGestureListener和OnChartValueSelectedListener两个接口供我们处理手势。
OnChartGestureListener
public interface OnChartGestureListener {

    void onChartGestureStart(MotionEvent me, ChartTouchListener.ChartGesture lastPerformedGesture);

    void onChartGestureEnd(MotionEvent me, ChartTouchListener.ChartGesture lastPerformedGesture);

    void onChartLongPressed(MotionEvent me);

    void onChartDoubleTapped(MotionEvent me);

    void onChartSingleTapped(MotionEvent me);

    void onChartFling(MotionEvent me1, MotionEvent me2, float velocityX, float velocityY);

    void onChartScale(MotionEvent me, float scaleX, float scaleY);

    void onChartTranslate(MotionEvent me, float dX, float dY);
}
从方法名就能看出在什么时候背调用了
OnChartValueSelectedListener
public interface OnChartValueSelectedListener {

    void onValueSelected(Entry e, Highlight h);

    void onNothingSelected();
}
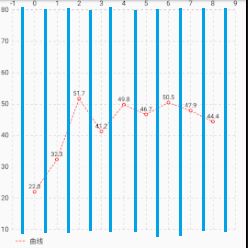
onValueSelected是图表中的某一个值被选择后被调用,但是并不是说一定要点在节点的圆环那里才会被选中,而是把图表分为一段一段,如下图所示:
点击整列的任何位置都会调用onValueSelected方法。
继承Linechart,初始化
第一步还是要继承LineChart,并进行初始化。
    private void initSingleTapLineChart() {

        values = new ArrayList<>();

        this.getDescription().setEnabled(false);
        this.setTouchEnabled(false);
        this.setDragEnabled(false);
        this.setScaleEnabled(false);
        this.setPinchZoom(false);
        this.setDrawBorders(false);

        // 设置是否可以触摸
        this.setTouchEnabled(true);
        // 监听触摸事件
        this.setOnChartGestureListener(this);
        this.setOnChartValueSelectedListener(this);
        // 是否可以拖拽
        this.setDragEnabled(true);
        // 是否可以缩放
        this.setScaleEnabled(false);

    }
最重要的是设置图表可以触摸,可以拖拽,并添加OnChartGestureListener和OnChartValueSelectedListener两个监听器。
给图表添加数据
这里我新建了一个setChartData方法,用户将ArrayList传进方法,先对折线进行配置,再添加到图表中。
    public void setChartData(ArrayList values) {
        this.values = values;
        XAxis xAxis = this.getXAxis();
        xAxis.setAxisMinimum(-1f);
        xAxis.setAxisMaximum(9f);
        xAxis.setGranularity(1f);
        xAxis.enableGridDashedLine(10f, 10f, 0f);
        xAxis.setDrawAxisLine(false);
        xAxis.setDrawLabels(true);
        xAxis.setLabelCount(11);
        YAxis leftAxis = this.getAxisLeft();
        leftAxis.removeAllLimitLines();
        leftAxis.setAxisMaximum(80f);
        leftAxis.setAxisMinimum(10f);
        leftAxis.setGranularity(10f);
        leftAxis.enableGridDashedLine(10f, 10f, 0f);
        leftAxis.setDrawZeroLine(false);
        leftAxis.setDrawAxisLine(false);
        leftAxis.setDrawLabels(true);
        this.getAxisRight().setEnabled(false);

        Legend l = this.getLegend();
        l.setForm(Legend.LegendForm.LINE);

        LineDataSet set1 = new LineDataSet(values, "曲线");

        set1.enableDashedLine(10f, 5f, 0f);
        set1.enableDashedHighlightLine(10f, 5f, 0f);
        set1.setColor(Color.RED);
        set1.setDrawCircles(true);
        set1.setCircleColor(Color.RED);
        set1.setLineWidth(1f);
        set1.setValueTextSize(9f);
        set1.setDrawFilled(false);
        set1.setFormLineWidth(1f);
        set1.setFormLineDashEffect(new DashPathEffect(new float[]{10f, 5f}, 0f));
        set1.setFormSize(15.f);

        ArrayList dataSets = new ArrayList<>();
        dataSets.add(set1);

        LineData data = new LineData(dataSets);
        //最后调用MPAndroidChart提供的setData方法
        this.setData(data);
    }
** 注意: ** 此方法是为了先配置折线,再调用MPAndroidChart提供的setData方法。
到此时已经可以正常的显示一个图表了,但还没有加入单击事件。
加入单击事件
onValueSelected
在这里先获取选中的值,拿到该值的Entry,通过getX()和getY()方法取得X,Y值,再通过getPixelForValues方法获得该值的像素坐标点。
    public void onValueSelected(Entry e, Highlight h) {
        // 获取Entry
        iEntry = (int) e.getX();
        valEntry = e.getY();
        Log.i(TAG, "e.getX() = " + iEntry + "     e.getY() = " + valEntry);
        // 获取选中value的坐标
        MPPointD p = this.getPixelForValues(e.getX(), e.getY(), YAxis.AxisDependency.LEFT);
        xValuePos = p.x;
        yValuePos = p.y;
        Log.i(TAG, "xValuePos = " + xValuePos + "     yValuePos = " + yValuePos);
    }
onChartGestureEnd
我这里选了onChartGestureEnd方法而不是onChartSingleTapped方法,只是因为我当时没注意到第二个,效果应该一样吧,嘿嘿。
先判断手势的类型,是不是单击事件,是的话就获得单击点的像素坐标点。
    public void onChartGestureEnd(MotionEvent me, ChartTouchListener.ChartGesture lastPerformedGesture) {
        Log.i(TAG, "onChartGestureEnd, lastGesture: " + lastPerformedGesture);
        if (lastPerformedGesture == ChartTouchListener.ChartGesture.SINGLE_TAP) {
            Log.i(TAG, "SingleTapped");
            yTouchPostion = me.getY();
            changeTouchEntry();
        }
        this.highlightValues(null);
    }
到这里我们就取得了需要数据的X值,Y值,原本的像素坐标点和单击处像素坐标点。
最后的处理
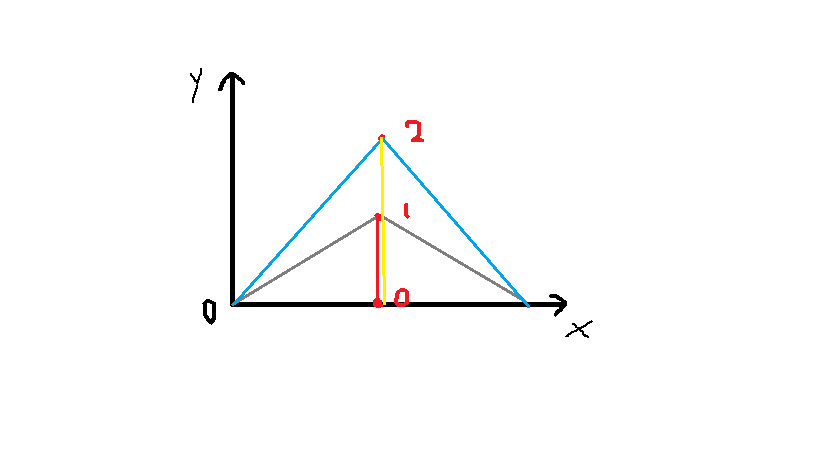
画了一个简单的图,比较好讲解。
如图,我们知道1点的Y值(Y1)和2点的Y值(Y2),同时求出了红线的长度(redLen),那么黄线的长度(yellowLen)显然就等于红线长度乘以Y2比Y1的值:
yellowLen = redLen * Y2 / Y1
换到表中,我们要求的是单击处对应在图表上的值,即黄线长度;红线长度是本来的Y值,Y2是单击点处到0坐标点处的距离,Y1是原来的值到0坐标点处的距离。
最后刷新数据,重绘图表。
    public void changeTouchEntry() {
        // 获取X轴和Y轴的0坐标的pixel值
        MPPointD p = this.getPixelForValues(0, 0, YAxis.AxisDependency.LEFT);
        double yAixs0 = p.y;
        // 修改TouchEntry的y的值
        Log.i(TAG, "计算过程");
        Log.i(TAG, "yAixs0: " + yAixs0);
        double y1 = yValuePos - yAixs0;
        double y2 = yTouchPostion - yAixs0;
        Log.i(TAG, "原来的y值所在的坐标减0点");
        Log.i(TAG, "yValuePos - yAixs0: " + y1);
        Log.i(TAG, "点击的y值所在的坐标减0点");
        Log.i(TAG, "yTouchPostion - yAixs0: " + y2);
        valEntry = (float) (valEntry * (y2 / y1));
        Log.i(TAG, "value");
        Log.i(TAG, "X: " + iEntry + "     Y: " + valEntry);
        values.set(iEntry, new Entry(iEntry, valEntry));
        this.notifyDataSetChanged();
        this.invalidate();
}
这样就完成了单击事件的处理。
添加响应接口
当然有时候我们要对单击事件做处理,所以再添加一个接口就行了。
    public interface OnSingleTapListener{
        void onSingleTap(int x,float y);
    }
接口的回调我放到了重绘图表后
this.notifyDataSetChanged();
        this.invalidate();

        if (onSingleTapListener != null){
            onSingleTapListener.onSingleTap(iEntry,valEntry);
        }
END
最后要说到一点,我把对图表的配置放到了自定义类里,这样第一减少Activity内的代码量,提高可读性;第二是比较方便,可以直接使用数据;
第三是一个应用中存在数个图表时,一般也会统一风格,这样写就能提高代码复用率了。
最后,博客里毕竟说得不详细,深入了解看代码,欢迎交流讨论:
https://github.com/xiaoniu/SingleTapLineChart
想要更了解MPAndroidChart,可以参考这一个系列的博客:
MPAndroidChart 教程----庄宏基


