爬虫练习案例--爬取天气并可视化
前言
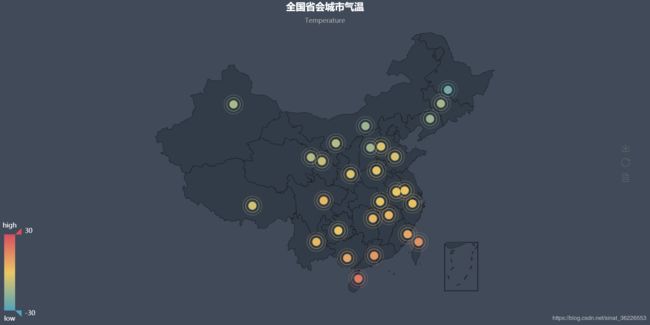
爬取各省会城市的气温,并用pyecharts库进行可视化
代码
import urllib.request
from urllib.request import quote
from bs4 import BeautifulSoup
import re
from pyecharts import Geo

''' 省会城市 '''
name0 = ['石家庄','沈阳','哈尔滨','杭州','福州','济南','广州','武汉','成都','昆明','兰州','台北','南宁','银川','太原','长春','南京','合肥','南昌','郑州','长沙','海口','贵阳','西安','西宁','呼和浩特','拉萨','乌鲁木齐']

lowTemp = []  # 记录最高气温
highTemp = [] # 记录最低气温

for i in range(len(name0)):
    name = quote(name0[i]) # URL编码

    '''获取城市代号编码'''
    url0 = 'http://toy1.weather.com.cn/search?cityname={}'.format(name)
    html0 = urllib.request.urlopen(url0)
    html0 = html0.read().decode('utf-8')
    code = re.search("\d{9}" , html0)

    url = "http://www.weather.com.cn/weather/{}.shtml".format(code[0])

    header = ("User-Agent","Mozilla/5.0 (Windows NT 10.0; Win64; x64) AppleWebKit/537.36 (KHTML, like Gecko) Chrome/69.0.3497.100 Safari/537.36")
    opener = urllib.request.build_opener()
    opener.addheaders = [header]
    request = urllib.request.Request(url)
    response = urllib.request.urlopen(request)
    html = response.read().decode('utf-8')

    bs = BeautifulSoup(html,"html.parser")
    body = bs.body
    data = body.find('div',{'id':'7d'})
    ul = data.find('ul')
    li = ul.find_all('li')[0]  # 获取今日天气li
    inf = li.find_all('p')  # 找到li中的所有p标签

    if inf[1].find('span') is None:
        temperature_highest = None # 天气预报可能没有当天的最高气温(到了傍晚会出现这种情况)
    else:
        temperature_highest = inf[1].find('span').string # 找到最高温度
        temperature_highest = temperature_highest.replace('℃', '') # 到了晚上网站会变,最高温度后面也有个℃
    temperature_lowest = inf[1].find('i').string  # 找到最低温度
    temperature_lowest = temperature_lowest.replace('℃', '')  # 最低温度后面有个℃,去掉这个符号

    highTemp.append(temperature_highest)
    lowTemp.append(temperature_lowest)

    print('\r成功获取{0}的天气情况...'.format(name0[i]),end='')


geo = Geo("全国省会城市气温", "Temperature",
    title_color="#fff", title_pos="center",width=1200, height=600,
    background_color='#404a59')
attr, value = name0, lowTemp
geo.add("", attr, value, visual_range=[-30, 30],
    visual_text_color="#fff", symbol_size=15, is_visualmap=True,
    type="effectScatter",effect_scale=3)
geo.render('全国省会城市气温图.html')
效果
其他
pyecharts库安装底图
pip install echarts-countries-pypkg

pip install echarts-china-provinces-pypkg

pip install echarts-china-cities-pypkg
