大数据项目实战之新闻话题的实时统计分析
前言:本文是一个完整的大数据项目实战,实时|离线统计分析用户的搜索话题,并用酷炫的前端界面展示出来。这些指标对网站的精准营销、运营都有极大帮助。架构大致是按照企业标准来的,从日志的采集、转化处理、实时计算、JAVA后台开发、WEB前端展示,一条完整流程线下来,甚至每个节点都用的高可用架构,都考虑了故障转移和容错性。所用到的框架包括:Hadoop(HDFS+MapReduce+Yarn)+Flume+KafKa+Hbase+Hive+Spark(SQL、Structured Streaming )+Hue+Mysql+SpringMVC+Mybatis+Websocket+AugularJs+Echarts。所涉及到的语言包括:JAVA、Scala、Shell。
由于本文并非零基础教学,所以只讲架构和流程,基础性知识自行查缺补漏。Github已经上传完整项目代码:liuyanling41-Github
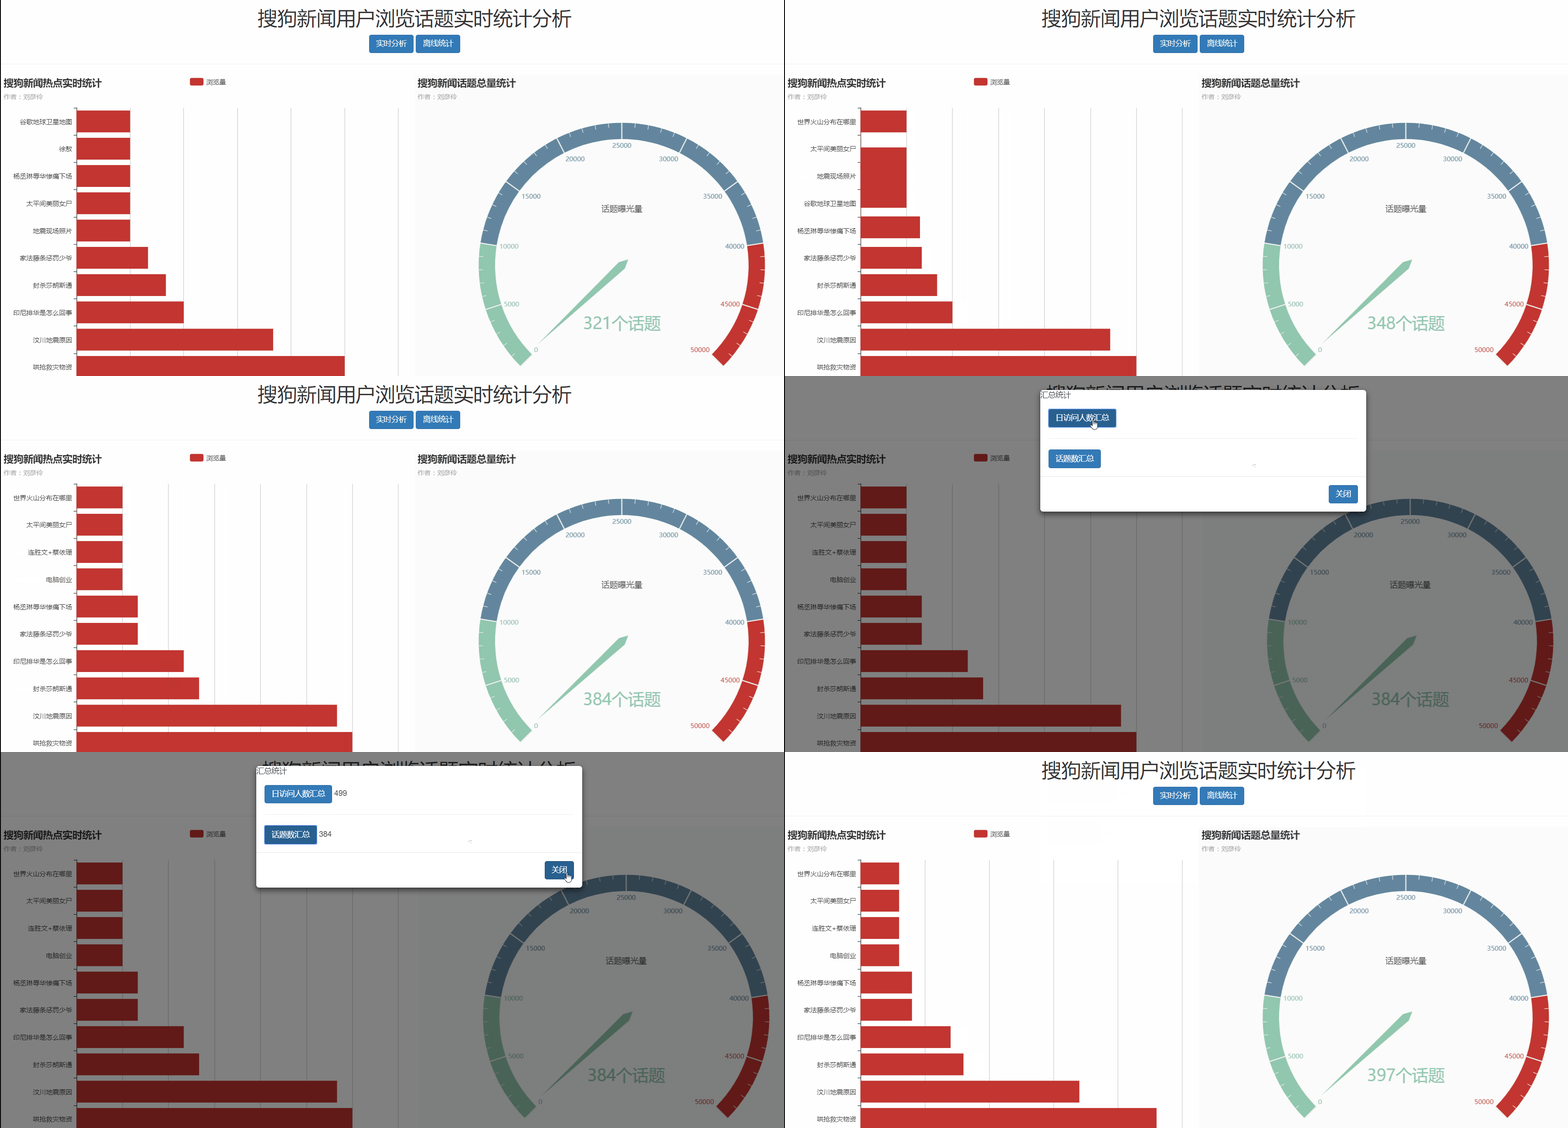
最终效果图如下:
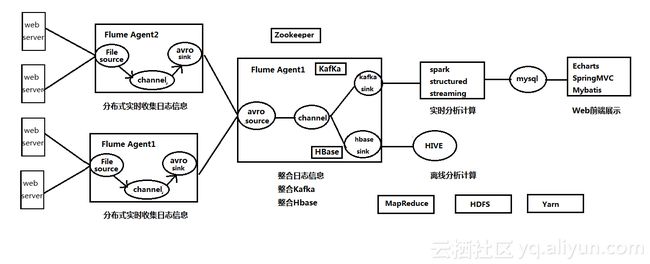
项目架构图如下:
环境准备
模拟网站实时产生日志信息
- 获取数据源,本文是利用搜狗的数据:搜狗实验室
- 编写java类模拟实时采集网站日志。主要利用Java中的输入输出流。写好后打成jar包传到服务器上
public class ReadWebLog {

    private static String readFileName;
    private static String writeFileName;

    public static void main(String args[]) {
        readFileName = args[0];
        writeFileName = args[1];
        readFile(readFileName);

    }

    public static void readFile(String fileName) {

        try {
            FileInputStream fis = new FileInputStream(fileName);
            InputStreamReader isr = new InputStreamReader(fis, "GBK");
            //以上两步已经可以从文件中读取到一个字符了,但每次只读取一个字符不能满足大数据的需求。故需使用BufferedReader,它具有缓冲的作用,可以一次读取多个字符
            BufferedReader br = new BufferedReader(isr);
            int count = 0;
            while (br.readLine() != null) {
                String line = br.readLine();
                count++;
                // 显示行号
                Thread.sleep(300);
                String str = new String(line.getBytes("UTF8"), "GBK");
                System.out.println("row:" + count + ">>>>>>>>" + line);
                writeFile(writeFileName, line);
            }
            isr.close();
        } catch (IOException e) {
            e.printStackTrace();
        } catch (InterruptedException e) {
            e.printStackTrace();
        }
    }


    public static void writeFile(String fileName, String conent) {
        try {
            FileOutputStream fos = new FileOutputStream(fileName, true);
            OutputStreamWriter osw = new OutputStreamWriter(fos);

            BufferedWriter bw = new BufferedWriter(osw);
            bw.write("\n");
            bw.write(conent);
            bw.close();
        } catch (UnsupportedEncodingException e) {
            e.printStackTrace();
        } catch (FileNotFoundException e) {
            e.printStackTrace();
        } catch (IOException e) {
            e.printStackTrace();
        }
    }
}
- 编写采集日志的shell脚本
vim weblog.sh
#/bin/bash
echo "start log"
java -jar /home/weblog.jar /usr/local/weblog.log /home/weblogs.logFlume Agent2采集日志信息
主要通过设置Source、Channel、Sink来完成日志采集。
- 配置flume配置文件
vim agent2.conf
a2.sources = r2
a2.channels = c2
a2.sinks = k2

a2.sources.r2.type = exec
#来源于weblogs.log文件
a2.sources.r2.command = tail -F /home/weblogs.log
a2.sources.r2.channels = c2

a2.channels.c2.type = memory
a2.channels.c2.capacity = 10000
a2.channels.c2.transactionCapacity = 100
a2.channels.c2.keep-alive = 10

a2.sinks.k2.type = avro
a2.sinks.k2.channel = c2
# 落地点是master机器的5555端口(主机名和端口号都必须与master机器的flume配置保持一致)
a2.sinks.k2.hostname = master
a2.sinks.k2.port = 5555- 编写shell脚本,方便运行。
vim flume.sh
#/bin/bash
echo "flume agent2 start"
bin/flume-ng agent --conf conf --name a2 --conf-file conf/agent2.conf -Dflume.root.logger=INFO,console- 运行的时候直接
./flume.sh即可
Flume Agent3采集日志信息
各方面配置都和Agent2完全一样、省略。
Flume Agent1整合日志信息
vim agent1.conf
#Flume Agent1实时整合日志信息

a1.sources = r1
a1.channels = kafkaC hbaseC
a1.sinks = kafkaS hbaseS

# flume + hbase
a1.sources.r1.type = avro
a1.sources.r1.channels = kafkaC hbaseC
a1.sources.r1.bind = master
a1.sources.r1.port = 5555

a1.channels.hbaseC.type = memory
a1.channels.hbaseC.capacity = 10000
a1.channels.hbaseC.transactionCapacity = 10000


a1.sinks.hbaseS.type = asynchbase
a1.sinks.hbaseS.table = weblogs
a1.sinks.hbaseS.columnFamily = info
a1.sinks.hbaseS.serializer = org.apache.flume.sink.hbase.SimpleAsyncHbaseEventSerializer
a1.sinks.hbaseS.serializer.payloadColumn = datatime,userid,searchname,retorder,cliorder,cliurl
a1.sinks.hbaseS.channel = hbaseC

# flume + kafka
a1.channels.kafkaC.type = memory
a1.channels.kafkaC.capacity = 10000
a1.channels.kafkaC.transactionCapacity = 10000

a1.sinks.kafkaS.channel = kafkaC
a1.sinks.kafkaS.type = org.apache.flume.sink.kafka.KafkaSink
a1.sinks.kafkaS.topic = weblogs
a1.sinks.kafkaS.brokerList = master:9092,slave1:9092,slave2:9092
a1.sinks.kafkaS.zookeeperConnect = master:2181,slave1:2181,slave2:2181
a1.sinks.kafkaS.requiredAcks = 1
a1.sinks.kafkaS.batchSize = 20
a1.sinks.kafkaS.serializer.class = kafka.serializer.StringEncoder
vim flume.sh
#/bin/bash
echo "flume agent1 start"
bin/flume-ng agent --conf conf --name a1 --conf-file conf/agent1.conf -Dflume.root.logger=INFO,console
具体讲解如下:
Flume与Hbase的集成
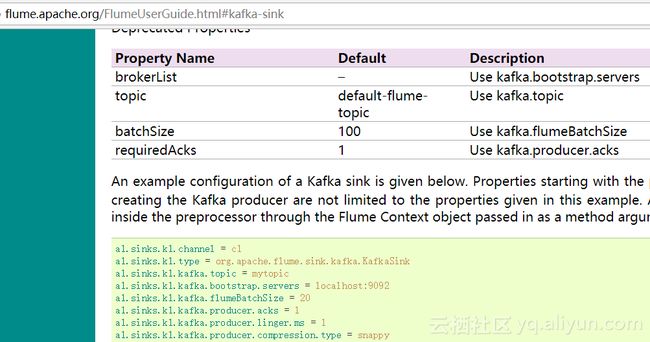
- 通过查看官方文档可知,Flume与Hbase的集成主要需要如下参数,表名、列簇名、以及Java类SimpleAsyncHbaseEventSerializer。
- 改写SimpleAsyncHbaseEventSerializer
下载Flume源码,需要改写如下两个Java类.
- Flume配置文件配置Sink为Hbase
a1.sinks.hbaseS.type = asynchbase
a1.sinks.hbaseS.table = weblogs
a1.sinks.hbaseS.columnFamily = info
a1.sinks.hbaseS.serializer = org.apache.flume.sink.hbase.SimpleAsyncHbaseEventSerializer
a1.sinks.hbaseS.serializer.payloadColumn = datatime,userid,searchname,retorder,cliorder,cliurl
a1.sinks.hbaseS.channel = hbaseC
Flume与Kafka的集成
- Flume配置文件:主要配置topic、brokerlist:
a1.sinks.kafkaS.channel = kafkaC
a1.sinks.kafkaS.type = org.apache.flume.sink.kafka.KafkaSink
a1.sinks.kafkaS.topic = weblogs
a1.sinks.kafkaS.brokerList = master:9092,slave1:9092,slave2:9092
a1.sinks.kafkaS.zookeeperConnect = master:2181,slave1:2181,slave2:2181
a1.sinks.kafkaS.requiredAcks = 1
a1.sinks.kafkaS.batchSize = 20
a1.sinks.kafkaS.serializer.class = kafka.serializer.StringEncoder- 编写kafka消费端脚本,消费从flume传过来的信息。
vim flume.sh
#/bin/bash
echo "flume agent1 start"
bin/kafka-console-consumer.sh --zookeeper master:2181,slave1:2181,slave2:2181 --topic weblogs --from-beginning- 运行效果图
Kafka与Spark集成完成数据实时处理
这里我选择的是2.2版本中的StructuredStreaming,因为它相比SparkStreaming而言有很多优势,它的出现重点就是解决端到端的精确一次语义,保证数据的不丢失不重复,这对于流式计算极为重要。StructuredStreaming的输入源为kafka,spark对来自kafka的数据进行计算,主要就是累加话题量和访问量。具体代码参考github。
    val spark = SparkSession.builder()
      .master("local[2]")
      .appName("streaming").getOrCreate()

    val df = spark
      .readStream
      .format("kafka")
      .option("kafka.bootstrap.servers", "master:9092")
      .option("subscribe", "weblogs")
      .load()

    import spark.implicits._
    val lines = df.selectExpr("CAST(value AS STRING)").as[String]
    val weblog = lines.map(_.split(",")).map(x => Weblog(x(0), x(1), x(2), x(3), x(4), x(5)))
    val titleCount = weblog.groupBy("searchname").count().toDF("titleName", "webcount")
Spark与Mysql集成
这里选择Mysql是因为,我们的需求只是报表展示,需要在前台展示的字段并不多,关系型数据库完全能够支撑。在Hbase里有几百万条数据(一个浏览话题可能有十几万人搜索过,也就是说一个话题就有十几万条数据,这么大量数据当然要存在Hbase中),而经过spark的计算,这十几万条数据在mysql中就变成了一条数据(XXX话题,XXX浏览量)。
如果业务需求变了,我需要实时查询用户各种信息(数据量很大,字段很多),那么当然就是实时的直接从Hbase里查,而不会在Mysql中。
所以企业中要根据不同的业务需求,充分考虑数据量等问题,进行架构的选择。
    val url = "jdbc:mysql://master:3306/weblog?useSSL=false"
    val username = "root"
    val password = "123456"

    val writer = new JdbcSink(url, username, password)
    val weblogcount = titleCount.writeStream
      .foreach(writer)
      .outputMode("update")
      .start()

    weblogcount.awaitTermination()
离线分析:HIVE集成HBASE。
我们知道Hive是一个数据仓库,主要就是转为MapReduce完成对大量数据的离线分析和决策。之前我们已经用Flume集成Hbase,使得Hbase能源源不断的插入数据。那么我们直接将HIVE集成HBase,这样只要Hbase有数据了,那Hive表也就有数据了。怎么集成呢?很简单,用【外部表】就搞定了。
CREATE EXTERNAL TABLE `weblogs`(
  `id` string COMMENT 'from deserializer',
  `datatime` string COMMENT 'from deserializer',
  `userid` string COMMENT 'from deserializer',
  `searchname` string COMMENT 'from deserializer',
  `retorder` string COMMENT 'from deserializer',
  `cliorder` string COMMENT 'from deserializer',
  `cliurl` string COMMENT 'from deserializer')
ROW FORMAT SERDE
  'org.apache.hadoop.hive.hbase.HBaseSerDe'
STORED BY
  'org.apache.hadoop.hive.hbase.HBaseStorageHandler'
WITH SERDEPROPERTIES (
  'hbase.columns.mapping'=':key,info:datatime,info:userid,info:searchname,info:retorder,info:cliorder,info:cliurl',
  'serialization.format'='1')
TBLPROPERTIES (
  'COLUMN_STATS_ACCURATE'='false',
  'hbase.table.name'='weblogs',
  'numFiles'='0',
  'numRows'='-1',
  'rawDataSize'='-1',
  'totalSize'='0',
  'transient_lastDdlTime'='1518778031')
验证一下HBASE和HIVE是不是同步的:
好了现在我们可以在Hive中尽情的离线分析和决策了~~~
SpringMVC+Mybatis完成对mysql数据的查询
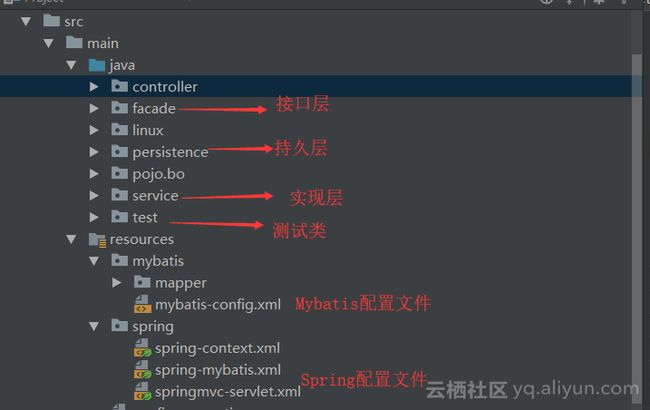
个人觉得传统JDBC实在是太笨重,还是最喜欢Spring整合Mybatis对数据库进行操作。这里主要完成的操作就是对mysql的数据进行查询。详情请参考github,地址文章开头已给出。
WebSocket实现全双工通信
既然要实现客户端实时接收服务器端的消息,而服务器端又实时接收客户端的消息,必不可少的就是WebSocket了,WebSocket实现了浏览器与服务器全双工通信(full-duple),能更好的节省服务器资源和带宽并达到实时通讯。WebSocket用HTTP握手之后,服务器和浏览器就使用这条HTTP链接下的TCP连接来直接传输数据,抛弃了复杂的HTTP头部和格式。一旦WebSocket通信连接建立成功,就可以在全双工模式下在客户端和服务器之间来回传送WebSocket消息。即在同一时间、任何方向,都可以全双工发送消息。WebSocket 核心就是OnMessage、OnOpen、OnClose,本项目使用的是和Spring集成的方式,因此需要有configurator = SpringConfigurator.class。
@ServerEndpoint(value = "/websocket", configurator = SpringConfigurator.class)
public class WebSocket {
    @Autowired
    private WebLogService webLogService;
    @OnMessage
    public void onMessage(String message, Session session) throws IOException, InterruptedException {
        String[] titleNames = new String[10];
        Long[] titleCounts = new Long[10];
        Long[] titleSum = new Long[1];
        while (true) {
            Map map = new HashMap();
            List list = webLogService.webcount();
            System.out.print(list);
            for (int i = 0; i < list.size(); i++) {
                titleNames[i] = list.get(i).getTitleName();
                titleCounts[i] = list.get(i).getWebcount();
            }
            titleSum[0] = webLogService.websum();
            map.put("titleName", titleNames);
            map.put("titleCount", titleCounts);
            map.put("titleSum", titleSum);
            System.out.print(map);
            session.getBasicRemote().sendText(JSON.toJSONString(map));
            Thread.sleep(1000);
            map.clear();
        }
    }

    @OnOpen
    public void onOpen() {
        System.out.println("Client connected");
    }

    @OnClose
    public void onClose() {
        System.out.println("Connection closed");
    }
}
Echarts完成前端界面展示
大家可以看到开头给出的项目效果图还是蛮漂亮的,其实非常简单,就是用的Echarts这个框架。直接给它传值就ok了,其他前端那些事它都给你搞定了。详情请参考github,地址文章开头已给出。
        function webcount(json) {
            var option = {
                title: {
                    text: '搜狗新闻热点实时统计',
                    subtext: '作者:刘彦伶'
                },
                tooltip: {
                    trigger: 'axis',
                    axisPointer: {
                        type: 'shadow'
                    }
                },
                legend: {
                    data: ['浏览量']
                },
                grid: {
                    left: '3%',
                    right: '4%',
                    bottom: '3%',
                    containLabel: true
                },
                xAxis: {
                    type: 'value',
                    boundaryGap: [0, 0.01]
                },
                yAxis: {
                    type: 'category',
                    data: json.titleName
                },
                series: [
                    {
                        name: '浏览量',
                        type: 'bar',
                        data: json.titleCount
                    },

                ]
            };
            countchart.setOption(option);
        }
本文讲解的比较粗糙,有很多细节的东西,毕竟一整个项目不可能用一篇文章说清楚。。。所以实践的东西需要读者自己去领悟,但是架构、环境搭建、方法、流程还是很有参考价值的!


