基于SVM的时间序列预测-python实现(附源码)
首先我们需要一些数据来对其进行预测:
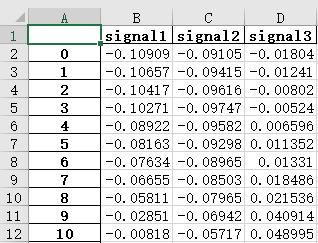
第0列是我们的序列号,single1,single2,single3是我们需要预测的数据,我们首先需要对其进行读取:
def read_20180829():
    fname = "20180829.xlsx"
    bk = xlrd.open_workbook(fname)
    # shxrange = range(bk.nsheets)
    try:
        sh = bk.sheet_by_name("Sheet1")
    except:
        print("no sheet in %s named Sheet1" % fname)
    # 获取行数
    nrows = sh.nrows
    # 获取列数
    ncols = sh.ncols
    # 获取第一行第一列数据
    cell_value = sh.cell_value(1, 0)
    time = []
    single1 = []
    single2 = []
    single3 = []
    # 获取各行数据
    for i in range(1, nrows):
        row_data = sh.cell_value(i, 0)
        time.append(row_data)
    for i in range(1, nrows):
        row_data = sh.cell_value(i, 1)
        single1.append(row_data)
    for i in range(1, nrows):
        row_data = sh.cell_value(i, 2)
        single2.append(row_data)
    for i in range(1, nrows):
        row_data = sh.cell_value(i, 3)
        single3.append(row_data)
    return time,single1,single2,single3
得到数据之后我们就可以对其进行预测了:
import numpy as np
from matplotlib import pyplot as plt
from sklearn.svm import SVR
from read_data import read_20180829
time,single1,single2,single3 = read_20180829()
# 需要预测的长度是多少
long_predict = 40
def svm_timeseries_prediction(c_parameter,gamma_paramenter):
    X_data = time
    Y_data = single1
    print(len(X_data))
    # 整个数据的长度
    long = len(X_data)
    # 取前多少个X_data预测下一个数据
    X_long = 1
    error = []
    svr_rbf = SVR(kernel='rbf', C=c_parameter, gamma=gamma_paramenter)
    # svr_rbf = SVR(kernel='rbf', C=1e5, gamma=1e1)
    # svr_rbf = SVR(kernel='linear',C=1e5)
    # svr_rbf = SVR(kernel='poly',C=1e2, degree=1)
    X = []
    Y = []
    for k in range(len(X_data) - X_long - 1):
        t = k + X_long
        X.append(Y_data[k:t])
        Y.append(Y_data[t + 1])
    y_rbf = svr_rbf.fit(X[:-long_predict], Y[:-long_predict]).predict(X[:])
    for e in range(len(y_rbf)):
        error.append(Y_data[X_long + 1 + e] - y_rbf[e])
    return X_data,Y_data,X_data[X_long+1:],y_rbf,error


X_data,Y_data,X_prediction,y_prediction,error = svm_timeseries_prediction(10,1)
figure = plt.figure()
tick_plot = figure.add_subplot(2, 1, 1)
tick_plot.plot(X_data, Y_data, label='data', color='green', linestyle='-')
tick_plot.axvline(x=X_data[-long_predict], alpha=0.2, color='gray')
# tick_plot.plot(X_data[:-X_long-1], y_rbf, label='data', color='red', linestyle='--')
tick_plot.plot(X_prediction, y_prediction, label='data', color='red', linestyle='--')
tick_plot = figure.add_subplot(2, 1, 2)
tick_plot.plot(X_prediction,error)
plt.show()
相关数据、代码网址:https://github.com/ZhiqiangHo/code-of-csdn/tree/master/time_series_prediction/SVM
我的微信公众号名称:深度学习与先进智能决策
微信公众号ID:MultiAgent1024
公众号介绍:主要研究强化学习、计算机视觉、深度学习、机器学习等相关内容,分享学习过程中的学习笔记和心得!期待您的关注,欢迎一起学习交流进步!