爬取微信朋友圈信息-可视化
自学 pyecharts 练手,画一下基本的柱状图和地图;用 wordcloud 生成词云;用 itchat 爬取微信信息;后面的代码就是基本的朋友圈数据信息整理
导入所需包
import pandas as pd
import itchat
from pyecharts import Pie, Map, Bar
from pyecharts_snapshot.main import make_a_snapshot
import jieba
from wordcloud import WordCloud, STOPWORDS
import numpy
import os
from IPython.display import IFrame
#登入自己的微信
itchat.auto_login(hotReload=True)
#爬取自己好友相关信息, 返回一个json文件
friends = itchat.get_friends(update=True)[0:]
#给微信助手发消息
itchat.send('Hello, filehelper', toUserName='filehelper')
爬取微信信息
#查看自己的信息,friends[0]表示自己,朋友信息要从friends[1]开始
print(friends[0])
len(friends)
打印数据比较多就不放在这里了
观察了一下返回的数据结构,发现”性别“是存放在一个字典里面的,key是”Sex“,男性值为1,女性为2,其他是不明性别的
微信好友性别分布
#性别计数初始化
male = female = other = 0
#建立循环,计算男女个数
for i in friends[1:]:
    sex = i["Sex"]
    if sex == 1:
        male += 1
    elif sex == 2:
        female += 1
    else:
        other += 1

#计算朋友总数
total = len(friends[1:])
#打印朋友个数
print(("朋友总数:%.u" % total) + "\n" +
     ("女性人数:%.u 占比:%.2f%%" % (female,float(female)/total*100)) + "\n" +
     ("男性人数:%.u 占比:%.2f%%" % (male,float(male)/total*100)) + "\n" +
     ("其他性别人数:%.u 占比:%.2f%%" % (other,float(other)/total*100)))
朋友总数:337
女性人数:182 占比:54.01%
男性人数:130 占比:38.58%
其他性别人数:25 占比:7.42%
#绘制性别饼图
sex=['male','female','other']
sex_n=[male,female,other]
pie=Pie("性别比例")
pie.add('',sex,sex_n,is_label_show=True)
pie.render("Sex.html")  #默认将会在根目录下生成一个 render.html 的文件,支持 path 参数,设置文件保存位置,如 render(r"e:\my_first_chart.html"),文件用浏览器打开。

make_a_snapshot('Sex.html', 'Sex.gif')
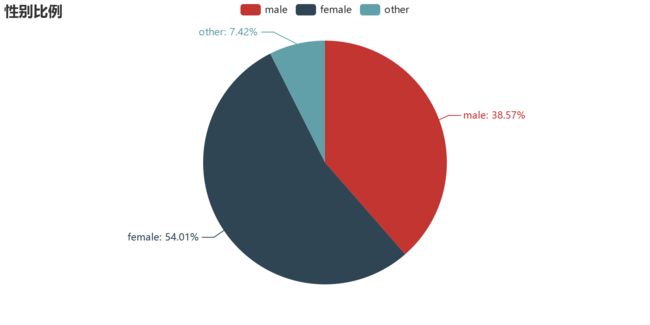
(本来这里的图片应该是HTML格式,是可交互的,但是导入之后总是不显示,只能转化为gif格式再导入了,等学会怎么调整了再放上上来)
由上图,女性好友过半,但男女比例并不悬殊。
print(male)
130 #有130个为男性
微信好友城市分布
#定义一个函数,爬取各个变量
def get_var(var):
    variable = []
    for i in friends:
        value = i[var]
        variable.append(value)
    return(variable)

#调用函数得到各个变量,并保存到CSV文件
NickName = get_var("NickName")
Sex = get_var("Sex")
City = get_var("City")
Province = get_var("Province")
Signature = get_var("Signature")

from pandas import DataFrame
data = {'NickName':NickName,'Sex':Sex,'City':City,'Province':Province,'Signature':Signature}
frame = DataFrame(data)
frame.to_csv('data.csv',encoding = "utf-8",index=True)
#frame.head()
#查看城市
import numpy as np
city_list = np.unique(frame['City'])
print("一共包含 {} 个城市,分别是:\n{}".format(len(city_list),city_list))
一共包含 80 个城市,分别是:
['' 'Columbia County' 'Geelong' 'Gold Coast' 'Kyoto' '丰台' '临汾' '临沂' '佛山'
 '保定' '信阳' '内江' '南京' '南开' '合肥' '吕梁' '周口' '咸阳' '唐山' '嘉兴' '大兴' '大同' '大堂区'
 '大连' '娄底' '宁波' '安阳' '定西' '岳阳' '巢湖' '巴音郭楞' '常德' '广州' '廊坊' '徐汇' '德国' '承德'
 '拉萨' '昆明' '朔州' '朝阳' '株洲' '榆林' '武汉' '沈阳' '沧州' '洛阳' '浦东新区' '海淀' '深圳' '温州'
 '湖州' '湘潭' '湘西' '濮阳' '石家庄' '石景山' '福州' '绍兴' '苏州' '茂名' '蚌埠' '衡水' '襄阳' '西城'
 '西安' '许昌' '通州' '邢台' '邯郸' '邵阳' '郑州' '郴州' '长寿' '长春' '长沙' '静安' '鹤壁' '黄山'
 '黑河']
#将城市分布信息汇总,创建字典sum_city
import pyecharts
City = [city for city in City if str(city) != '']
new_list1 = []
for city in City:
    new_list1.append(city)

from collections import Counter
sum_city = Counter(new_list1)
x0, y0 = pyecharts.base.Base.cast(sum_city)
print(x0)
print(y0)
print(sum_city)
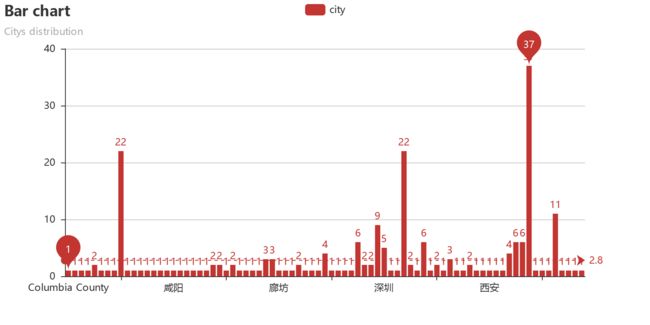
['Columbia County', 'Geelong', 'Gold Coast', 'Kyoto', '丰台', '临汾', '临沂', '佛山', '保定', '信阳', '内江', '南京', '南开', '合肥', '吕梁', '周口', '咸阳', '唐山', '嘉兴', '大兴', '大同', '大堂区', '大连', '娄底', '宁波', '安阳', '定西', '岳阳', '巢湖', '巴音郭楞', '常德', '广州', '廊坊', '徐汇', '德国', '承德', '拉萨', '昆明', '朔州', '朝阳', '株洲', '榆林', '武汉', '沈阳', '沧州', '洛阳', '浦东新区', '海淀', '深圳', '温州', '湖州', '湘潭', '湘西', '濮阳', '石家庄', '石景山', '福州', '绍兴', '苏州', '茂名', '蚌埠', '衡水', '襄阳', '西城', '西安', '许昌', '通州', '邢台', '邯郸', '邵阳', '郑州', '郴州', '长寿', '长春', '长沙', '静安', '鹤壁', '黄山', '黑河']
[1, 1, 1, 1, 2, 1, 1, 1, 22, 1, 1, 1, 1, 1, 1, 1, 1, 1, 1, 1, 1, 1, 2, 2, 1, 2, 1, 1, 1, 1, 3, 3, 1, 1, 1, 2, 1, 1, 1, 4, 1, 1, 1, 1, 6, 2, 2, 9, 5, 1, 1, 22, 2, 1, 6, 1, 2, 1, 3, 1, 1, 2, 1, 1, 1, 1, 1, 4, 6, 6, 37, 1, 1, 1, 11, 1, 1, 1, 1]
Counter({'郑州': 37, '保定': 22, '湘潭': 22, '长沙': 11, '海淀': 9, '沧州': 6, '邯郸': 6, '石家庄': 6, '邵阳': 6, '深圳': 5, '邢台': 4, '朝阳': 4, '常德': 3, '广州': 3, '苏州': 3, '湘西': 2, '洛阳': 2, '大连': 2, '丰台': 2, '安阳': 2, '承德': 2, '娄底': 2, '衡水': 2, '福州': 2, '浦东新区': 2, '朔州': 1, '信阳': 1, '绍兴': 1, '石景山': 1, '佛山': 1, '临汾': 1, '长春': 1, '宁波': 1, '大兴': 1, '巢湖': 1, '嘉兴': 1, '沈阳': 1, '濮阳': 1, '大同': 1, 'Geelong': 1, '通州': 1, '许昌': 1, '黑河': 1, '咸阳': 1, '大堂区': 1, '株洲': 1, '内江': 1, '廊坊': 1, '静安': 1, '武汉': 1, '西安': 1, '南开': 1, '徐汇': 1, '唐山': 1, 'Gold Coast': 1, '拉萨': 1, '南京': 1, '巴音郭楞': 1, '蚌埠': 1, '温州': 1, 'Columbia County': 1, '榆林': 1, 'Kyoto': 1, '吕梁': 1, '长寿': 1, '茂名': 1, '周口': 1, '湖州': 1, '合肥': 1, '襄阳': 1, '黄山': 1, '鹤壁': 1, '昆明': 1, '西城': 1, '郴州': 1, '临沂': 1, '德国': 1, '定西': 1, '岳阳': 1})
# 城市分布柱状图
from pyecharts_snapshot.main import make_a_snapshot
bar = Bar("Bar chart", "Citys distribution")
bar.add("city", x0, y0, mark_line=["average"], mark_point=["max", "min"],is_label_show=True)
bar.render("City.html")

make_a_snapshot('City.html', 'City.gif')
#选出分布超过3人的城市,并画出柱状图
dictfilt = lambda x, y: dict([ (i,x[i]) for i in x if i in set(y) ])
wanted_keys = ("郑州","保定",'湘潭','长沙','海淀','邵阳','邯郸','沧州','深圳','邢台','朝阳','石家庄')
new_city = dictfilt(sum_city, wanted_keys)
x1, y1 = pyecharts.base.Base.cast(new_city)

bar = Bar("Bar chart", "Citys of more than three people")
bar.add("city", x1, y1, mark_line=["average"], mark_point=["max", "min"],is_label_show=True)
bar.render("City2.html")

make_a_snapshot('City2.html', 'City2.gif')
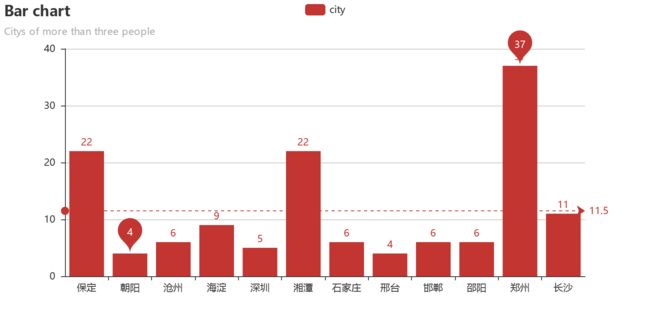
由图可知,郑州、保定、湘潭三地的人数最多,这也与笔者在这三地呆过较长时间的情况相符
#分别选出河北、湖南的好友
hb_list = []
hun_list = []
other_list = []
for i in friends[1:]:
    city = i["City"]
    province = i["Province"]
    if province == '河北':
        hb_list.append(city)
    elif province == '湖南':
        hun_list.append(city)
    else:
        other_list.append(city)
#将河北省的城市列表放入字典sum_hb,并将key和value分别放入两个列表
sum_hb = Counter(hb_list)
hb_x, hb_y  = pyecharts.base.Base.cast(sum_hb)
print(sum_hb, hb_x, hb_y)
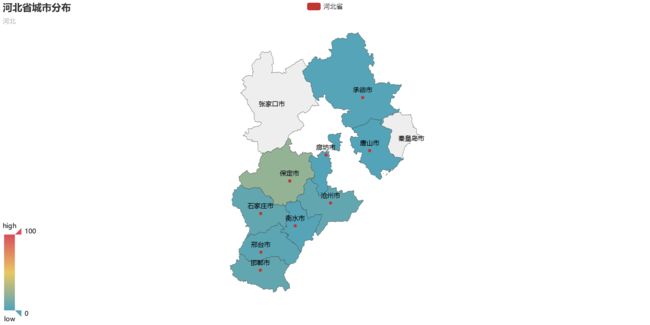
Counter({'保定': 22, '沧州': 6, '邯郸': 6, '石家庄': 6, '邢台': 4, '承德': 2, '衡水': 2, '廊坊': 1, '唐山': 1}) ['保定', '唐山', '廊坊', '承德', '沧州', '石家庄', '衡水', '邢台', '邯郸'] [22, 1, 1, 2, 6, 6, 2, 4, 6]
#在hb_x中的每个元素后添加“市”
s = '市'
for i in range(len(hb_x)):
    hb_x[i] =  hb_x[i] + s
hbs_x = hb_x
print(hbs_x)
['保定市', '唐山市', '廊坊市', '承德市', '沧州市', '石家庄市', '衡水市', '邢台市', '邯郸市']
#朋友圈河北省城市分布地图
from pyecharts_snapshot.main import make_a_snapshot

map1 = Map("河北省城市分布","河北", width=1200, height=600)
map1.add("河北省", hbs_x, hb_y,maptype='河北', is_visualmap=True, is_label_show=True, visual_text_color='#000')
map1.show_config()
map1.render("hebei.html")

make_a_snapshot('hebei.html','hebei.gif')
#IFrame('http://localhost:8888/view/wechat/%E6%B2%B3%E5%8C%97.html', width='100%', height=600)
#将河北省的城市列表放入字典sum_hun,并将key和value分别放入两个列表
sum_hun = Counter(hun_list)
hun_x, hun_y  = pyecharts.base.Base.cast(sum_hun)
print(sum_hun, hun_x, hun_y)
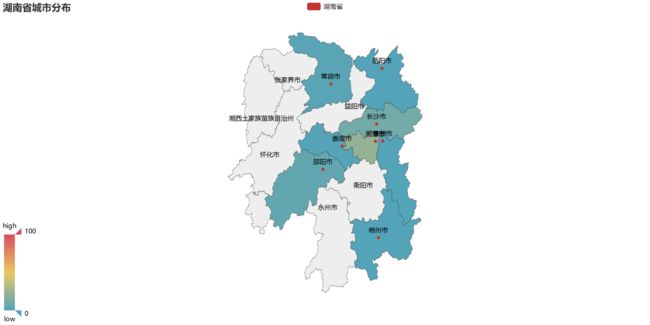
Counter({'湘潭': 22, '长沙': 11, '邵阳': 6, '常德': 3, '湘西': 2, '娄底': 2, '株洲': 1, '郴州': 1, '岳阳': 1}) ['娄底', '岳阳', '常德', '株洲', '湘潭', '湘西', '邵阳', '郴州', '长沙'] [2, 1, 3, 1, 22, 2, 6, 1, 11]
#在hb_x中的每个元素后添加“市”
s = '市'
for i in range(len(hun_x)):
    hun_x[i] =  hun_x[i] + s
huns_x = hun_x
print(huns_x)
['娄底市', '岳阳市', '常德市', '株洲市', '湘潭市', '湘西市', '邵阳市', '郴州市', '长沙市']
#朋友圈湖南省城市分布地图
map = Map("湖南省城市分布", width=1200, height=600)
map.add("湖南省", huns_x, hun_y, maptype='湖南', is_visualmap=True, is_label_show=True, visual_text_color='#000')
map.show_config()
map.render("hunan.html")

make_a_snapshot('hunan.html','hunan.gif')
微信好友省份分布
#查看省份
prov_list = np.unique(frame['Province'])
print("一共包含 {} 个省份,分别是:\n{}".format(len(prov_list),prov_list))
一共包含 50 个省份,分别是:
['' 'Addu Atoll' 'Ash Shariqah' 'Barcelona' 'Burgenland' 'Chiang Mai'
 'Dubai' 'Dubayy' 'Florida' 'Hamburg' 'Kyoto-fu' 'Leiden' 'Leipzig'
 'Madrid' 'North Ari Atoll' 'North Shore' 'Parana' 'Paris' 'Queensland'
 'Sai Kung' 'Schaffhausen' 'Toronto' 'Umm al Qaiwain' 'Victoria' '上海' '云南'
 '北京' '吉林' '四川' '天津' '安徽' '山东' '山西' '广东' '新疆' '江苏' '河北' '河南' '浙江' '湖北'
 '湖南' '澳门' '甘肃' '福建' '西藏' '贵州' '辽宁' '重庆' '陕西' '黑龙江']
Province = [prov for prov in Province if str(prov) != '']
new_list2 = []
for prov in Province:
    new_list2.append(prov)

from collections import Counter
sum_province = Counter(new_list2)
x2, y2 = pyecharts.base.Base.cast(sum_province)
print(x2)
print(y2)
print(sum_province)
['Addu Atoll', 'Ash Shariqah', 'Barcelona', 'Burgenland', 'Chiang Mai', 'Dubai', 'Dubayy', 'Florida', 'Hamburg', 'Kyoto-fu', 'Leiden', 'Leipzig', 'Madrid', 'North Ari Atoll', 'North Shore', 'Parana', 'Paris', 'Queensland', 'Sai Kung', 'Schaffhausen', 'Toronto', 'Umm al Qaiwain', 'Victoria', '上海', '云南', '北京', '吉林', '四川', '天津', '安徽', '山东', '山西', '广东', '新疆', '江苏', '河北', '河南', '浙江', '湖北', '湖南', '澳门', '甘肃', '福建', '西藏', '贵州', '辽宁', '重庆', '陕西', '黑龙江']
[1, 1, 2, 1, 1, 1, 3, 1, 1, 1, 1, 1, 1, 1, 1, 1, 2, 1, 1, 1, 1, 1, 1, 4, 1, 24, 1, 1, 2, 4, 2, 4, 10, 1, 4, 50, 46, 5, 3, 49, 1, 1, 2, 1, 1, 3, 1, 3, 1]
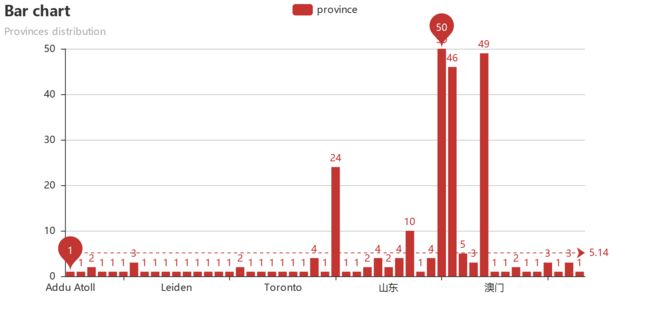
Counter({'河北': 50, '湖南': 49, '河南': 46, '北京': 24, '广东': 10, '浙江': 5, '山西': 4, '安徽': 4, '江苏': 4, '上海': 4, '辽宁': 3, '陕西': 3, '湖北': 3, 'Dubayy': 3, '山东': 2, '天津': 2, 'Barcelona': 2, 'Paris': 2, '福建': 2, 'Umm al Qaiwain': 1, '吉林': 1, 'Sai Kung': 1, 'Victoria': 1, '贵州': 1, '黑龙江': 1, 'Leipzig': 1, '澳门': 1, '四川': 1, 'Parana': 1, 'Queensland': 1, '西藏': 1, '新疆': 1, 'Florida': 1, 'Dubai': 1, 'Kyoto-fu': 1, 'Addu Atoll': 1, 'Chiang Mai': 1, '重庆': 1, 'Burgenland': 1, 'Schaffhausen': 1, 'North Ari Atoll': 1, '云南': 1, 'Hamburg': 1, '甘肃': 1, 'Madrid': 1, 'Leiden': 1, 'Toronto': 1, 'North Shore': 1, 'Ash Shariqah': 1})
# 省份分布柱状图
bar = Bar("Bar chart", "Provinces distribution")
bar.add("province", x2, y2, mark_line=["average"], mark_point=["max", "min"],is_label_show=True)
bar.render("Province.html")

make_a_snapshot("Province.html","Province.gif")
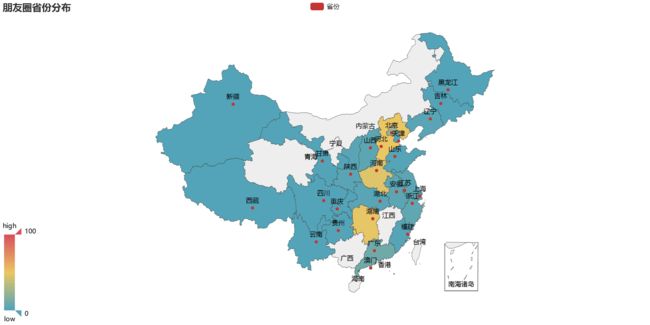
#朋友圈省份分布地图
map = Map("朋友圈省份分布", width=1200, height=600)
map.add("省份", x2, y2, maptype='china', is_visualmap=True, is_label_show=True, visual_text_color='#000')
map.show_config()
map.render("Province3.html")

make_a_snapshot("Province3.html","Province3.gif")
#选出分布超过3人的省份,并画出柱状图
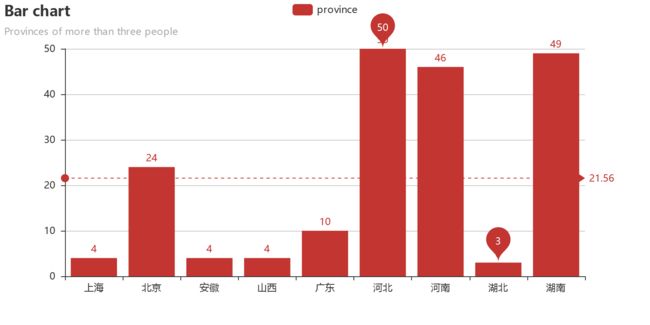
wanted_keys = ('河南','河北','湖南','长沙','北京','广东','湖北','山西','安徽','上海')
new_province = dictfilt(sum_province, wanted_keys)
x3, y3 = pyecharts.base.Base.cast(new_province)

bar = Bar("Bar chart", "Provinces of more than three people")
bar.add("province", x3, y3, mark_line=["average"], mark_point=["max", "min"],is_label_show=True)
bar.render("Provinces2.html")

make_a_snapshot("Provinces2.html","Provinces2.gif")
由上图可知,笔者在河北、河南、湖南这三地的朋友最多
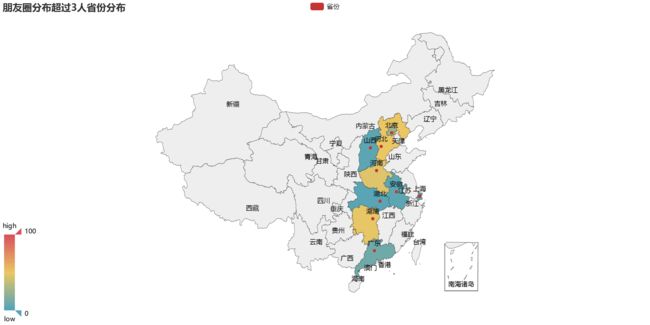
#朋友圈分布超过3人省份分布地图
map = Map("朋友圈分布超过3人省份分布", width=1200, height=600)
map.add("省份", x3, y3, maptype='china', is_visualmap=True, is_label_show=True, visual_text_color='#000')
map.show_config()
map.render("Province4.html")

make_a_snapshot("Province4.html","Province4.gif")
print(x3,y3)
['上海', '北京', '安徽', '山西', '广东', '河北', '河南', '湖北', '湖南'] [4, 24, 4, 4, 10, 50, 46, 3, 49]
用微信个性签名创建词云
#替换特殊字符,清洗中文词库,得到text
import re
siglist = []
for i in friends:
    signature = i["Signature"].strip().replace("span","").replace("class","").replace("emoji","")
    rep = re.compile("1f\d+\w*|[<>/=]")
    signature = rep.sub("", signature)
    siglist.append(signature)
text = "".join(siglist)
import jieba
wordlist = jieba.cut(text, cut_all=True)
word_space_split = " ".join(wordlist)
Building prefix dict from the default dictionary ...
DEBUG:jieba:Building prefix dict from the default dictionary ...
Loading model from cache C:\Users\dell\AppData\Local\Temp\jieba.cache
DEBUG:jieba:Loading model from cache C:\Users\dell\AppData\Local\Temp\jieba.cache
Loading model cost 2.780 seconds.
DEBUG:jieba:Loading model cost 2.780 seconds.
Prefix dict has been built succesfully.
DEBUG:jieba:Prefix dict has been built succesfully.
import matplotlib.pyplot as plt
from wordcloud import WordCloud, ImageColorGenerator
import numpy as np
import PIL.Image as Image

coloring = np.array(Image.open("D:/qjj/Jupyter_Projects/wechat/cat3.png"))
my_wordcloud = WordCloud(background_color="white", max_words=2000,
                         mask=coloring, max_font_size=50, random_state=42, scale=2,
                         font_path="D:/qjj/Jupyter_Projects/fonts/STHeiti Light.ttc").generate(word_space_split)

image_colors = ImageColorGenerator(coloring)
plt.imshow(my_wordcloud.recolor(color_func=image_colors))
plt.imshow(my_wordcloud)
plt.axis("off")
plt.show()
my_wordcloud.to_file("D:/qjj/Jupyter_Projects/wechat/my_wordcloud3.png")

根据朋友圈的个性签名生成词云,字体越大表示出现的频率越大,“时间”、“人生”、“自己”、“工作”都是频率比较大的词汇,看来朋友们比较关注自身生活和工作状态,关注时间。
