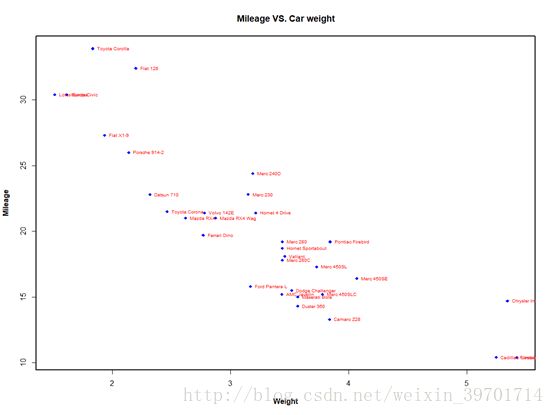
R_4th 图形的文本标注
R_4th 图形的文本标注
attach是将数据添加上内存中,一般用于数据框,添加之后就可以直接提取数据框的,但是一般用完都会detach()删除掉
text () 可以在绘图区进行文本添加
mtext()可以在图形的四个边界添加文本
其主要参数有
text : location 、“text ” 、 pos
mtext : “text” 、 side 、 line = n
location可以定义文本位置参数, 可以为一对x、y 坐标,也可以通过locator(1)进行鼠标定位
pos : 文本位置 一般 1= 下, 2 = 左, 3= 上,4= 右 。
side : 同理, mtext的位置,和pos一样。
其他还有 cex 缩放大小、 font文字样式 1= 常规、2=粗体、3=斜体 4= 粗斜体
比如以下代码
> attach(mtcars)
> plot(wt,mpg,main = "Mileage VS. Car weight",xlab= "Weight", ylab = "Mileage",pch = 18, col = "blue")
> text(wt,mpg,row.names(mtcars),cex=0.6,pos =4, col ="red")
> detach(mtcars)
第一行attach 。
第二行创建一个散点图
第三行文本标注,由于是在图上标注,所以为text, row.names(mtcars)、 cex缩放0.6 , pos 4 右边。所以就有了下图。
第四行 detach删除掉数据。
书中同样还有一定的补充:
> opar <- par(no.readonly = TRUE)
> par(cex= 1.5)
> plot(1:7 , 1:7, type = "n")
> text(3,3,"Example of default text")
> text(4,4,family = "mono" , "Example of mono-spaced text")
> text(5,5,family= "serif", "Example of serif text")
> par(opar)
> text(locator(1),"sb")
par函数设定环境 cex = 1.5,
plot创建坐标轴,text(3,3)、(4,4)、(5,5)可以定义文本的坐标轴位置。在结束后尝试用locator(1)可以使用鼠标来拖动文本的位置,如下图所示。
