python机器学习经典实例-学习笔记4-线性回归-实例
实例一. 估算房屋价格
是时候用所学的知识来解决真实世界的问题了。让我们用这些原理来估算房屋价格。房屋估价是理解回归分析最经典的案例之一,通常是一个不错的切入点。它符合人们的直觉,而且与人们的生活息息相关,因此在用机器学习处理复杂事情之前,通过房屋估价可以更轻松地理解相关概念。我们将使用带AdaBoost算法的决策树回归器(decision tree regressor)来解决这个问题。
- 网上有一个标准房屋价格数据库,人们经常用它来研究机器学习。你可以在https://archive.ics.uci.edu/ml/datasets/Housing下载数据。不过scikit-learn提供了数据接口,可以直接通过下面的代码加载数据:
housing_data = datasets.load_boston()
每个数据点由影响房价的13个输入参数构成。你可以用housing_data.data获取输入的数据,用housing_data.target获取对应的房屋价格。
- 接下来把输入数据与输出结果分成不同的变量。我们可以通过shuffle函数把数据的顺序打乱:
X, y = shuffle(housing_data.data, housing_data.target, random_state=7)
- 参数random_state用来控制如何打乱数据,让我们可以重新生成结果。接下来把数据分成训练数据集和测试数据集,其中80%的数据用于训练,剩余20%的数据用于测试:
   num_training = int(0.8 * len(X))
    X_train, y_train = X[:num_training], y[:num_training]
    X_test, y_test = X[num_training:], y[num_training:]
- 现在已经可以拟合一个决策树回归模型了。选一个最大深度为4的决策树,这样可以限制决策树不变成任意深度:
   dt_regressor = DecisionTreeRegressor(max_depth=4)
    dt_regressor.fit(X_train, y_train)
- 再用带AdaBoost算法的决策树回归模型进行拟合:
   # Fit decision tree regression model with AdaBoost
    ab_regressor = AdaBoostRegressor(DecisionTreeRegressor(max_depth=4), n_estimators=400, random_state=7)
    ab_regressor.fit(X_train, y_train)
- 接下来评价决策树回归器的训练效果:
   # Evaluate performance of Decision Tree regressor
    y_pred_dt = dt_regressor.predict(X_test)
    mse = mean_squared_error(y_test, y_pred_dt)
    evs = explained_variance_score(y_test, y_pred_dt)
    print ("\n#### Decision Tree performance ####")
    print ("Mean squared error =", round(mse, 2))
    print ("Explained variance score =", round(evs, 2))
- 现在评价一下AdaBoost算法改善的效果:
   # Evaluate performance of AdaBoost
    y_pred_ab = ab_regressor.predict(X_test)
    mse = mean_squared_error(y_test, y_pred_ab)
    evs = explained_variance_score(y_test, y_pred_ab)
    print ("\n#### AdaBoost performance ####")
    print ("Mean squared error =", round(mse, 2))
    print ("Explained variance score =", round(evs, 2))
所有特征都同等重要吗?在这个案例中,我们用了13个特征,它们对模型都有贡献。但是,有一个重要的问题出现了:如何判断哪个特征更加重要?显然,所有的特征对结果的贡献是不一样的。如果需要忽略一些特征,就需要知道哪些特征不太重要。scikit-learn里面有这样的功能。
- 画出特征的相对重要性,在housing.py文件中加入下面几行代码:
plot_feature_importances(dt_regressor.feature_importances_,
'Decision Tree regressor', housing_data.feature_names)
plot_feature_importances(ab_regressor.feature_importances_,
'AdaBoost regressor', housing_data.feature_names)
- 接下来需要定义plot_feature_importances来画出条形图
def plot_feature_importances(feature_importances, title, feature_names):
    # Normalize the importance values
    feature_importances = 100.0 * (feature_importances / max(feature_importances))

    # Sort the values and flip them
    index_sorted = np.flipud(np.argsort(feature_importances))

    # Arrange the X ticks
    pos = np.arange(index_sorted.shape[0]) + 0.5

    # Plot the bar graph
    plt.figure()
    plt.bar(pos, feature_importances[index_sorted], align='center')
    plt.xticks(pos, feature_names[index_sorted])
    plt.ylabel('Relative Importance')
    plt.title(title)
    plt.show()
《》
   # Plot relative feature importances
    plot_feature_importances(dt_regressor.feature_importances_,
            'Decision Tree regressor', housing_data.feature_names)
    plot_feature_importances(ab_regressor.feature_importances_,
            'AdaBoost regressor', housing_data.feature_names)
输出结果
#### Decision Tree performance ####
Mean squared error = 14.79
Explained variance score = 0.82

#### AdaBoost performance ####
Mean squared error = 7.64
Explained variance score = 0.91
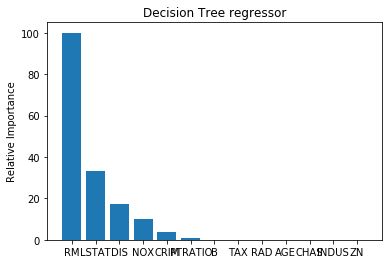
我们从feature_importances_方法里取值,然后把数值放大到0~100的范围内。运行前面的代码,可以看到两张图(不带AdaBoost算法与带AdaBoost算法两种模型)。
从上图可以发现,不带AdaBoost算法的决策树回归器显示的最重要特征是RM
加入AdaBoost算法之后,房屋估价模型的最重要特征是LSTAT。在现实生活中,如果对这个数据集建立不同的回归器,就会发现最重要的特征是LSTAT,这足以体现AdaBoost算法对决策树回归器训练效果的改善。
编辑于 2018-03-20
