python画ROC曲线如何画的好看
import numpy as np
from sklearn.metrics import confusion_matrix, accuracy_score,f1_score,roc_auc_score,recall_score,precision_score
from sklearn import metrics
from matplotlib import pyplot
styles=['fivethirtyeight',
'dark_background',
'bmh',
'classic',
'seaborn-dark',
'grayscale',
'seaborn-deep',
'seaborn-muted',
'seaborn-colorblind',
'seaborn-white',
'seaborn-dark-palette',
'ggplot',
'tableau-colorblind10',
'_classic_test',
'seaborn-darkgrid',
'seaborn-notebook',
'Solarize_Light2',
'seaborn-paper',
'seaborn-whitegrid',
'seaborn-pastel',
'seaborn-talk',
'seaborn-bright',
'seaborn',
'seaborn-ticks',
'seaborn-poster',
'fast']
def rocs_plot(y2, P2, setname=''):
pyplot.figure(figsize=(5, 4), dpi=100)
pyplot.style.use('seaborn-darkgrid')
palette = pyplot.get_cmap('Set1')
for i, p2 in enumerate(P2):
fpr1, tpr1, thresholds1 = metrics.roc_curve(y2[i], p2, pos_label=1)
roc_auc1 = metrics.auc(fpr1, tpr1)
pyplot.plot(fpr1, tpr1, lw=1, color=palette(i), linewidth=1.5, alpha=0.9, label=result_paths[i][:-10]+", AUC=%0.3f" % (roc_auc1))
pyplot.xlim([0.00, 1.0])
pyplot.ylim([0.00, 1.0])
pyplot.xlabel("1-Specificity",fontsize=12)
pyplot.ylabel("Sensitivity",fontsize=12)
pyplot.title("ROC",fontsize=12)
pyplot.legend(loc="lower right")
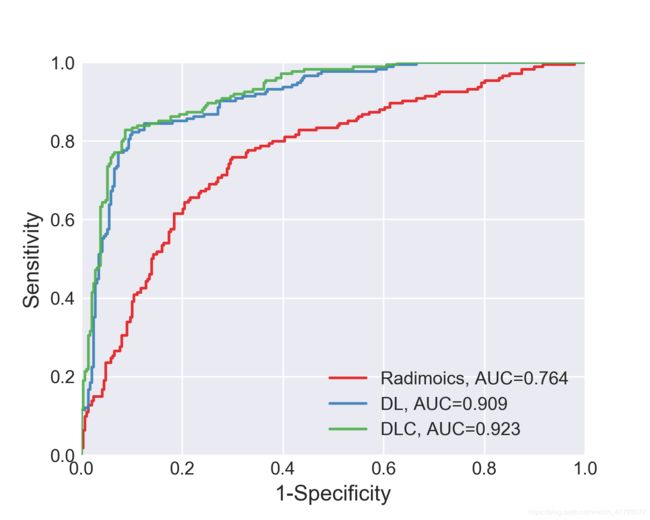
pyplot.savefig('ROC.png',dpi=300)pyplot画图太丑,改个风格就好
pyplot.style.use('seaborn-darkgrid')里面的风格可以自己改,'seaborn-darkgrid' 风格出来大概是这样的,比默认格式好看多了: