pyecharts新版本的运用
官方链接:https://pyecharts.org/#/zh-cn/global_options
二话不说,我的实际案例:
pyecharts新版本案例
(1)条形图
from pyecharts.charts import Bar

from pyecharts import options as opts

# 条形图

from pyecharts.globals import ThemeType


bar = (

    Bar(init_opts=opts.InitOpts(theme=ThemeType.LIGHT))

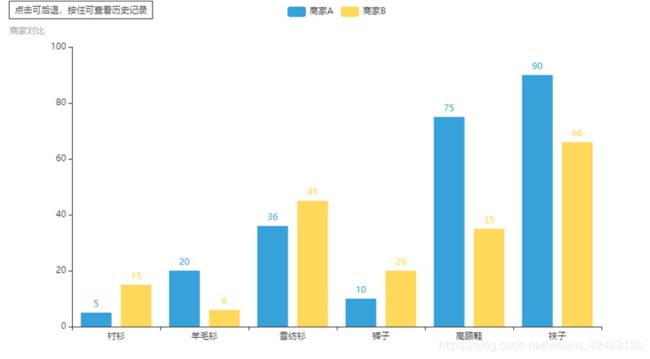
        .add_xaxis(["衬衫", "羊毛衫", "雪纺衫", "裤子", "高跟鞋", "袜子"])

        .add_yaxis("商家A", [5, 20, 36, 10, 75, 90])

        .add_yaxis("商家B", [15, 6, 45, 20, 35, 66])

        .set_global_opts(title_opts=opts.TitleOpts (title="商家销售情况", subtitle="商家对比"))
)
)
bar.render()
实验结果:
(2)雷达图
from pyecharts import options as opts
from pyecharts.charts import Page, Radar
#雷达图
v1 = [[4300, 10000, 28000, 35000, 50000, 19000]]
v2 = [[5000, 14000, 28000, 31000, 42000, 21000]]
def radar_base() -> Radar:
c = (
Radar()
.add_schema(
schema=[
opts.RadarIndicatorItem(name="销售", max_=6500),
opts.RadarIndicatorItem(name="管理", max_=16000),
opts.RadarIndicatorItem(name="信息技术", max_=30000),
opts.RadarIndicatorItem(name="客服", max_=38000),
opts.RadarIndicatorItem(name="研发", max_=52000),
opts.RadarIndicatorItem(name="市场", max_=25000),
]
)
.add("预算分配", v1)
.add("实际开销", v2)
.set_series_opts(label_opts=opts.LabelOpts(is_show=False))
.set_global_opts(title_opts=opts.TitleOpts(title="部门开销"))
)
return c
c = radar_base()
c.render('leida.html')
实验结果
(3)词云图
from pyecharts import options as opts
from pyecharts.charts import WordCloud
words = [
("Sam S Club", 10000),
("Macys", 6181),
("Amy Schumer", 4386),
("Jurassic World", 4055),
("Charter Communications", 2467),
("Chick Fil A", 2244),
("Planet Fitness", 1868),
("Pitch Perfect", 1484),
("Express", 1112),
("Home", 865),
("Johnny Depp", 847),
("Lena Dunham", 582),
]
def wordcloud_base() -> WordCloud:
c = (
WordCloud()
.add("", words, word_size_range=[20, 100])
.set_global_opts(title_opts=opts.TitleOpts(title="词云"))
)
return c
c=wordcloud_base()
c.render('ciyun.html')
实验结果
![]() 正在上传…重新上传取消
正在上传…重新上传取消


