python之Pyecharts基础
1.生成图片
Pyecharts是1.5.0版本,其他版本不保证代码可执行性
代码
from pyecharts.charts import Bar
from pyecharts import options as opts

bar = Bar()
x = list(range(1, 6))
y = [111, 120, 130, 142, 150]
bar.add_xaxis(x)
bar.add_yaxis("商家A", y)
bar.set_global_opts(title_opts=opts.TitleOpts(title='基本标题', subtitle='副标题'))
bar.render(r'C:\Users\lenovo\PycharmProjects\Test1\exam\templates\hello.html')

x轴需要是列表,y轴有两个参数
render()函数默认生成图片保存在本地render.html
render_notebook()则是在 notebook里
也可以自己设置保存路径
2.设置y轴或x轴的最小值和峰值
继承上面所引入的模块
bar.set_global_opts(yaxis_opts=opts.AxisOpts(max_=140))

设置y轴坐标轴的峰值;
x轴峰值为设置值+1,且会混乱
3.设置滑动式图片显示
bar.set_global_opts(title_opts=opts.TitleOpts(subtitle="副标题"), datazoom_opts=opts.DataZoomOpts(is_show=True))

注意:多个配置语句同时存在时,后面会覆盖前面
4.标记当前页面的特殊值
bar.set_series_opts(markpoint_opts=opts.MarkPointOpts(
     data=[
           opts.MarkPointItem(type_='max', name='最大值'),
           opts.MarkPointItem(type_='min', name='最小值')
          ]
            ))
此时标记的最大值与最小值
配图,若遇到滑动式图片则标记滑动页面的最值

5.设置图形颜色
bar.add_yaxis("商家A", y, itemstyle_opts=opts.ItemStyleOpts(color='black'))
6.设置主题
from pyecharts.charts import Bar
from pyecharts import options as opts
from pyecharts.globals import ThemeType

bar = Bar(init_opts=opts.InitOpts(theme=ThemeType.PURPLE_PASSION))
这只是一种主题,主题会更改标题和坐标轴颜色,有多种多样根据自己喜好
7.更改数值字体为斜体并且设置大小
bar.set_series_opts(label_opts=opts.LabelOpts
(font_style='italic', font_size=20))
8.显示工具箱
bar.set_global_opts(title_opts=opts.TitleOpts(title='基本标题', subtitle="副标题"), toolbox_opts=opts.ToolboxOpts())
有刷新,放大缩小,下载等功能
9.横轴显示数据
代码加入一句话
bar.reversal_axis()
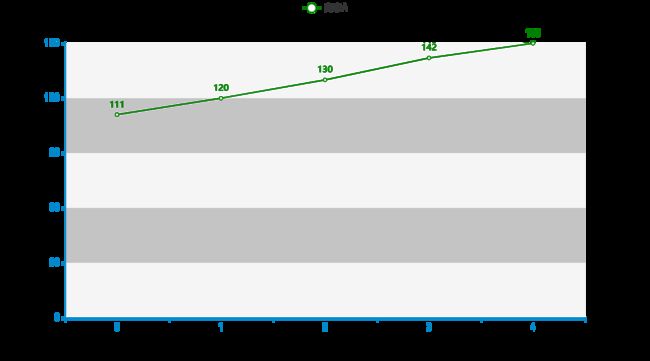
10.折线图
类似于柱形图
from pyecharts.charts import Line
from pyecharts import options as opts
from pyecharts.globals import ThemeType

line = Line(init_opts=opts.InitOpts(theme=ThemeType.MACARONS))
x = list(range(5))
y = [111, 120, 130, 142, 150]
line.add_xaxis(x)
line.add_yaxis("商家A", y, itemstyle_opts=opts.ItemStyleOpts(color='green'))
line.render()
11.饼状图
制作单个饼图
from pyecharts.charts import Pie
from pyecharts import options as opts
pie = Pie()
x1 = ['百度', '阿里巴巴', '腾讯', '拼多多']
y1 = [28, 32, 15, 45]
pie.add('', [i for i in zip(x1, y1)])
pie.set_global_opts(title_opts=opts.TitleOpts(title='饼图'))
12.多组饼图
from pyecharts.charts import Pie
from pyecharts import options as opts
pie = Pie()
x1 = ['百度', '阿里巴巴', '腾讯', '拼多多']
y1 = [28, 32, 15, 45]
x2 = ['美女', '模特', '公主', '学生']
y2 = [20, 30, 10, 40]
pie.add(series_name="成交量", data_pair=[i for i in zip(x1, y1)],
        center=[225, 250],                设置饼图中心的位置
        radius=["10%", "50%"],            设置饼图的大小,圆圈及整体
        rosetype='radius')                设置半径表示多少
pie.add(series_name="销售额",              别名显示
        data_pair=[i for i in zip(x2, y2)],
        center=[625, 250],                调节中心位置使得两个饼图不会重叠
        radius=["10%", "50%"])
pie.render()


