matplotlib保存图片设置分辨率
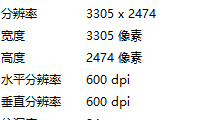
论文要求图片dpi=600,之前画曲线图都是采取保存方式为savefig(dpi=600),然后查看保存图片的属性信息
但是最近画混淆矩阵的时候,特别奇怪,再这样设置dpi=600. 最终生成的图片属性总是dpi=96, 到现在没发现啥情况,我让别人给我跑了一下我的程序,生成的却是dpi=600. 难道电脑不一样吗? 同样的程序,为啥生成的图片属性不同??????????求大神解答,下面是我的程序:
import numpy as np
import matplotlib
import matplotlib.pyplot as plt

# sphinx_gallery_thumbnail_number = 2


# 蔬菜种类
vegetables = ["cucumber", "tomato", "lettuce", "asparagus",
              "potato", "wheat", "barley"]
# 农夫名字
farmers = ["Farmer Joe", "Upland Bros.", "Smith Gardening",
           "Agrifun", "Organiculture", "BioGoods Ltd.", "Cornylee Corp."]

# 收成
harvest = np.array([[0.8, 2.4, 2.5, 3.9, 0.0, 4.0, 0.0],
                    [2.4, 0.0, 4.0, 1.0, 2.7, 0.0, 0.0],
                    [1.1, 2.4, 0.8, 4.3, 1.9, 4.4, 0.0],
                    [0.6, 0.0, 0.3, 0.0, 3.1, 0.0, 0.0],
                    [0.7, 1.7, 0.6, 2.6, 2.2, 6.2, 0.0],
                    [1.3, 1.2, 0.0, 0.0, 0.0, 3.2, 5.1],
                    [0.1, 2.0, 0.0, 1.4, 0.0, 1.9, 6.3]])

# fig, ax = plt.subplots()
fig = plt.figure(dpi=600)
ax = fig.add_subplot(1,1,1)
im = ax.imshow(harvest)

# 设置x,y坐标长度
ax.set_xticks(np.arange(len(farmers)))
ax.set_yticks(np.arange(len(vegetables)))

# x,y具体标签
ax.set_xticklabels(farmers)
ax.set_yticklabels(vegetables)

# x轴标签旋转45°显示
plt.setp(ax.get_xticklabels(), rotation=45, ha="right",
         rotation_mode="anchor")

# 显示每个方格的值
for i in range(len(vegetables)):
    for j in range(len(farmers)):
        text = ax.text(j, i, harvest[i, j],
                       ha="center", va="center", color="w")

ax.set_title("Harvest of local farmers (in tons/year)")
fig.tight_layout()
plt.savefig("cm.jpeg",dpi = 600)
plt.show()
为啥设置dpi指定了, 生成图片属性还是dpi=96?????
