Julia教程7 Julia绘图
在网易云课堂上直接搜索:Julia教程 ,就可以找到,教程的全名是:Julia教程 从入门到进阶
这是国内第一个免费的完整的Julia视频教程,非常适合Julia的入门。有兴趣的朋友可以去学习一下。
教程链接:
Julia教程
欢迎关注微信公众号:Quant_Times
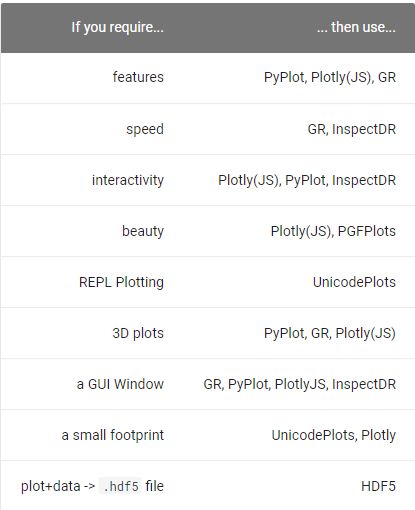
绘图工具
官方推荐
官方推荐 Plots
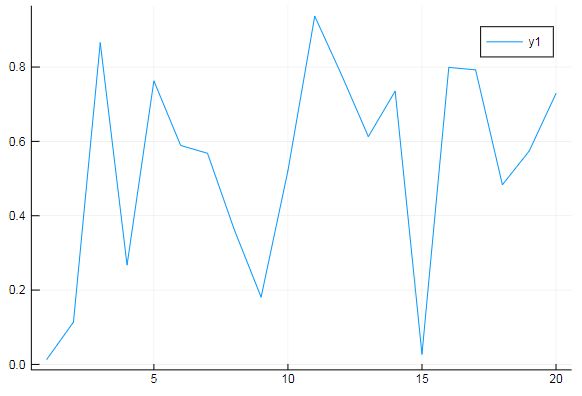
简单的绘图
using Plots
y = rand(20,1)
plot(y,linewidth=2,title="My Plot")
Plots配合portfoliocomposition能够画出代码量少而且有内容丰富的图片,但在Julia v1.0版本中好像目前还不支持,等支持后会专门做一个用Plots绘图的教程。
快速绘图工具 GR
GR的速度比较快,一般画一些简单的图时可以选择用GR。
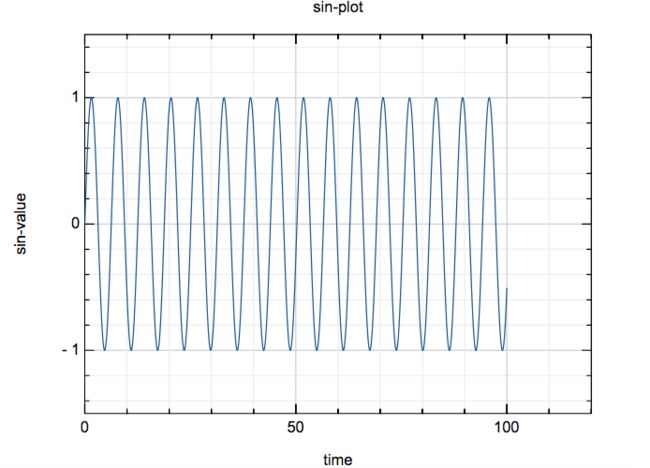
绘简单的正弦曲线,加上标题,label
using GR
x = 0:0.1:100
y = sin.(x)
xlim([0, 120])
ylim([-1.5, 1.5])
xlabel("time")
ylabel("sin-value")
title("sin-plot")
plot(x, y)
一个图中绘4条曲线,添加label
x = 1:0.1:100
y1 = sin.(x)
y2 = 2*sin.(2 .* x)
y3 = 3*sin.(3 .* x)
y4 = 4*sin.(4 .* x)
y = [y1 y2 y3 y4]
legend("sinx", "sin2x", "sin3x", "sin4x")
xlabel("x")
ylabel("y")
xlim([0, 100])
ylim([-4.5, 4.5])
title("rand-plot")
plot(x, y[:,1], "r",
     x, y[:,2], "g",
     x, y[:,3], "b",
     x, y[:,4], "black")
[外链图片转存失败,源站可能有防盗链机制,建议将图片保存下来直接上传(img-sRk1FOo5-1592662305436)(https://raw.githubusercontent.com/Bounce00/pic/master/Julia course/Julia绘图4.png)]
绘bessel函数
using SpecialFunctions
x = collect(0:0.01:20)
legend("0 order", "1 order", "2 order", "3 order")
title("Bessel function")
title("Bessel function")
xlim([0, 20])
ylim([-1, 1])
plot(x, SpecialFunctions.besselj.(0, x),
     x, SpecialFunctions.besselj.(1, x),
     x, SpecialFunctions.besselj.(2, x),
     x, SpecialFunctions.besselj.(3, x))
[外链图片转存失败,源站可能有防盗链机制,建议将图片保存下来直接上传(img-3etWq0hj-1592662305438)(https://raw.githubusercontent.com/Bounce00/pic/master/Julia course/Julia绘图5.png)]
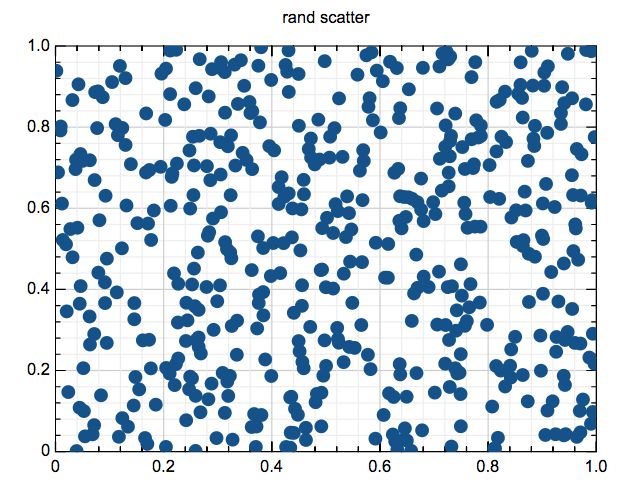
散点图
n = 500
x = rand(n)
y = rand(n)
title("rand scatter")
scatter(x, y)
科学计算绘图工具Gadfly
using Gadfly
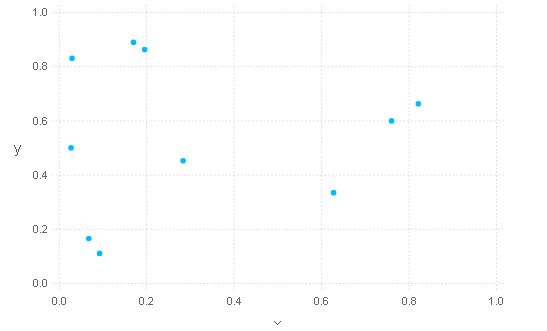
plot(x=rand(10), y=rand(10))
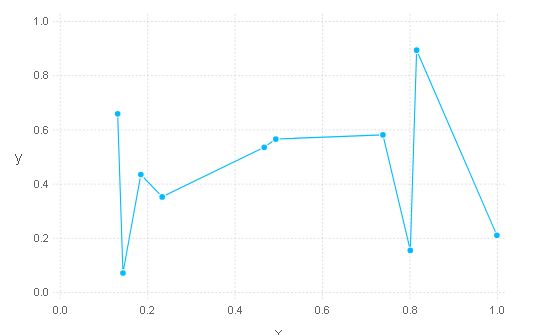
plot(x=rand(10), y=rand(10), Geom.point, Geom.line)
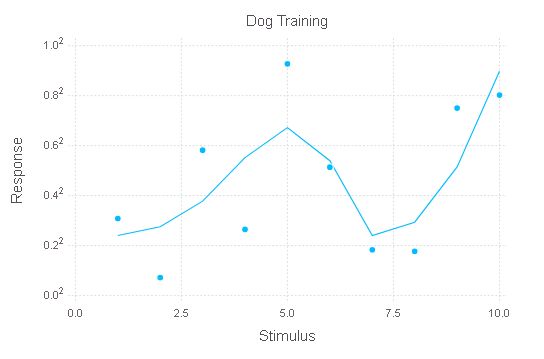
plot(x=1:10, y=rand(10).^2,
     Scale.y_sqrt, Geom.point, Geom.smooth,
     Guide.xlabel("Stimulus"), Guide.ylabel("Response"), Guide.title("Dog Training"))
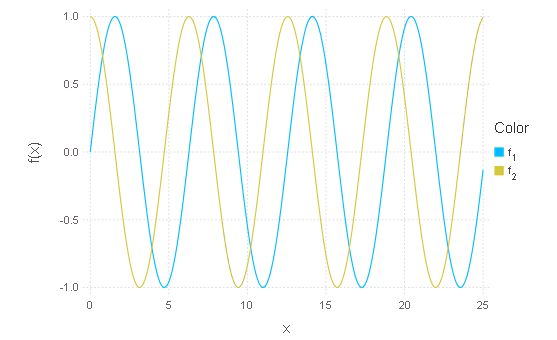
一个plot中画两条曲线
plot([sin, cos], 0, 25)
PyPlot
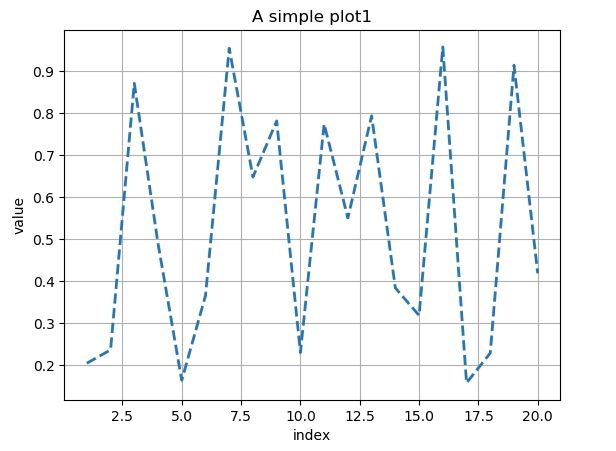
一维数据
using PyPlot
y = rand(20)
x = 1:20
# pygui(true)
plot(x, y, lw=2.0, linestyle="--")
grid(true)
axis("tight")
xlabel("index")
ylabel("value")
title("A simple plot1")
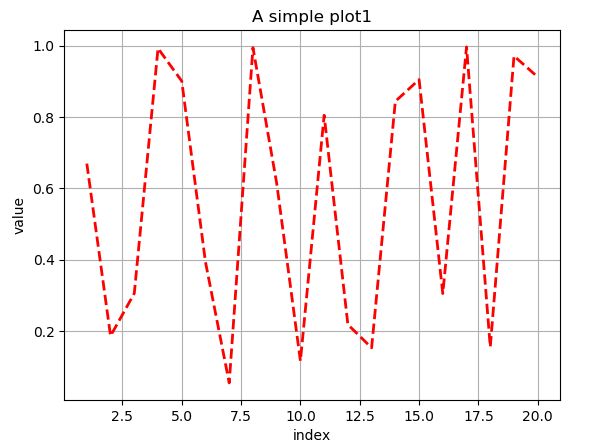
设置线条颜色
y = rand(20)
x = 1:20
# pygui(true)
plot(x, y, lw=2.0, color="r", linestyle="--")
grid(true)
axis("tight")
xlabel("index")
ylabel("value")
title("A simple plot1")
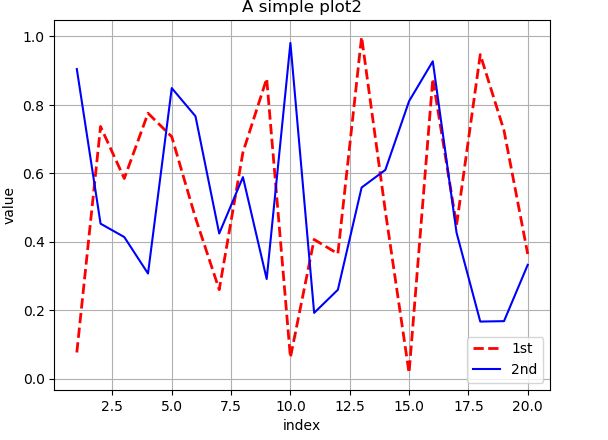
二维数据
y = rand(20,2)
x = 1:20
using PyPlot
# pygui(true)
plot(x, y[:,1], lw=2.0, label="1st", color="r", linestyle="--")
plot(x, y[:,2], lw=1.5, label="2nd", color="b", linestyle="-")
grid(true)
legend(loc=0)
axis("tight")
xlabel("index")
ylabel("value")
title("A simple plot2")
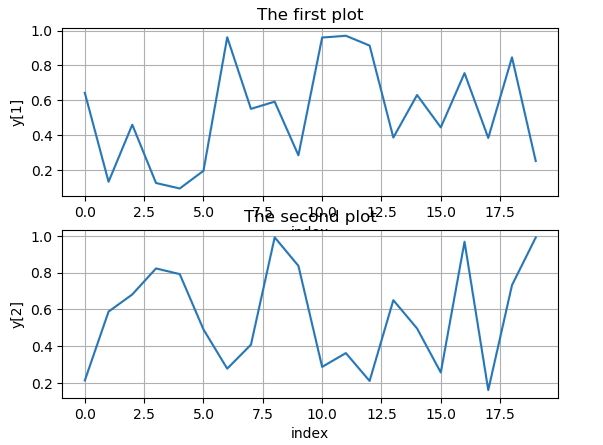
多个子图
y = rand(20,2)
x = 1:20
# pygui(true)
subplot(211)
plot(y[:,1], lw=1.5, label="1st")
grid(true)
axis("tight")
xlabel("index")
ylabel("y[1]")
title("The first plot")
subplot(212)
plot(y[:,2], lw=1.5, label="1st")
grid(true)
axis("tight")
xlabel("index")
ylabel("y[2]")
title("The second plot")
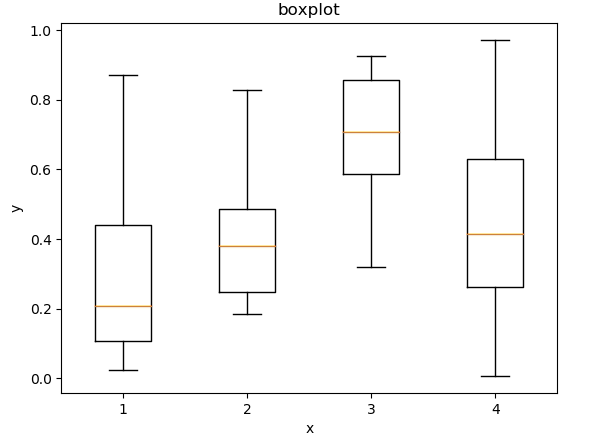
箱体图
y = rand(10,4)
boxplot(y)
xlabel("x")
ylabel("y")
title("boxplot")
# show()
微信公众号:Quant_Times
