吴恩达机器学习课程笔记+代码实现(6)Python实现多变量线性回归、梯度下降和正规方程(Programming Exercise 1.2)
Programming Exercise 1: Linear Regression
Python版本3.6
编译环境:anaconda Jupyter Notebook
链接:ex1data1.txt、ex1data2.txt 和编程作业ex1.pdf(实验指导书)
提取码:i7co
2 多变量线性回归(Linear regression with multiple variable)
本章课程笔记部分见:4.多变量线性回归、梯度下降和正规方程
2.1查看数据
The file ex1data2.txt contains a training set of housing prices in Portland, Oregon. The first column is the size of the house (in square feet), the second column is the number of bedrooms, and the third column is the price of the house.
%matplotlib inline
#IPython的内置magic函数,可以省掉plt.show(),在其他IDE中是不会支持的
import numpy as np
import pandas as pd
import matplotlib as mpl
import matplotlib.pyplot as plt
import seaborn as sns
sns.set(style="whitegrid",color_codes=True)
df = pd.read_csv('ex1data2.txt', header=None, names=['Size', 'Bedrooms', 'Price'])
df.head()#查看前五行
| size | bedrooms | price | |
|---|---|---|---|
| 0 | 2104 | 3 | 399900 |
| 1 | 1600 | 3 | 329900 |
| 2 | 2400 | 3 | 369000 |
| 3 | 1416 | 2 | 232000 |
| 4 | 3000 | 4 | 539900 |
df.describe()#查看数据相关统计
| size | bedrooms | price | |
|---|---|---|---|
| count | 47.000000 | 47.000000 | 47.000000 |
| mean | 2000.680851 | 3.170213 | 340412.659574 |
| std | 794.702354 | 0.760982 | 125039.899586 |
| min | 852.000000 | 1.000000 | 169900.000000 |
| 25% | 1432.000000 | 3.000000 | 249900.000000 |
| 50% | 1888.000000 | 3.000000 | 299900.000000 |
| 75% | 2269.000000 | 4.000000 | 384450.000000 |
| max | 4478.000000 | 5.000000 | 699900.000000 |
df.info()#查看数据DataFrame
RangeIndex: 47 entries, 0 to 46
Data columns (total 3 columns):
size        47 non-null int64
bedrooms    47 non-null int64
price       47 non-null int64
dtypes: int64(3)
memory usage: 1.2 KB
2.2 特标准化(Feature Normalization)
多维特征问题的时候,保证这些特征都具有相近的尺度,需要进行特征缩放,这将帮助梯度下降算法更快地收敛。
最简单的方法是:Z-score标准化方法,也称均值归一化(mean normaliztion), 给予原始数据的均值(mean)和标准差(standard deviation)进行数据的标准化。经过处理的数据符合标准正态分布,即均值为0,标准差为1。转化函数为 x n = x n − μ n s n {{x}_{n}}=\frac{{{x}_{n}}-{{\mu}_{n}}}{{{s}_{n}}} xn=snxn−μn,其中 μ n {\mu_{n}} μn是平均值, s n {s_{n}} sn是标准差。
df = (df - df.mean())/df.std()
df.head()
| size | bedrooms | price | |
|---|---|---|---|
| 0 | 0.130010 | -0.223675 | 0.475747 |
| 1 | -0.504190 | -0.223675 | -0.084074 |
| 2 | 0.502476 | -0.223675 | 0.228626 |
| 3 | -0.735723 | -1.537767 | -0.867025 |
| 4 | 1.257476 | 1.090417 | 1.595389 |
2.3 梯度下降
现在利用梯度下降找出拟合数据集的线性回归参数θ
线性回归的目标是最小化参数θ为特征函数的代价函数
J ( θ ) = 1 2 m ∑ i = 1 m ( h θ ( x ( i ) ) − y ( i ) ) 2 J\left( \theta \right)=\frac{1}{2m}\sum\limits_{i=1}^{m}{{{\left( {{h}_{\theta }}\left( {{x}^{(i)}} \right)-{{y}^{(i)}} \right)}^{2}}} J(θ)=2m1i=1∑m(hθ(x(i))−y(i))2
而: h θ ( x ) = θ T X = θ 0 x 0 + θ 1 x 1 + θ 2 x 2 + . . . + θ n x n {{h}_{\theta }}\left( x \right)={{\theta }^{T}}X={{\theta }_{0}}{{x}_{0}}+{{\theta }_{1}}{{x}_{1}}+{{\theta }_{2}}{{x}_{2}}+...+{{\theta }_{n}}{{x}_{n}} hθ(x)=θTX=θ0x0+θ1x1+θ2x2+...+θnxn
本案例中是二变量线性回归,假设
h θ ( x ) = θ T X = θ 0 + θ 1 x 1 + θ 2 x 2 {{h}_{\theta }}\left( x \right)={{\theta }^{T}}X={{\theta }_{0}}+{{\theta }_{1}}{{x}_{1}}+{{\theta }_{2}}{{x}_{2}} hθ(x)=θTX=θ0+θ1x1+θ2x2
#计算代价函数
def computeCost(X,Y,theta):
    h = X * theta.T
    cost = np.power((h - Y),2)
    j = np.sum(cost)/(2 * len(X))
    return j
和单变量线性回归模型一样,故为实现向量化相乘的操作,数据集中增加一列数值为1的数据,即 X 0 = 1 X_{0}=1 X0=1
df.insert(0,"x_0",1)
将数据集中抽离输入X与结果Y
X = df.iloc[:,0:3]
X.head()
| x_0 | size | bedrooms | |
|---|---|---|---|
| 0 | 1 | 0.130010 | -0.223675 |
| 1 | 1 | -0.504190 | -0.223675 |
| 2 | 1 | 0.502476 | -0.223675 |
| 3 | 1 | -0.735723 | -1.537767 |
| 4 | 1 | 1.257476 | 1.090417 |
Y = df.iloc[:,3:4]
Y.head()
| price | |
|---|---|
| 0 | 0.475747 |
| 1 | -0.084074 |
| 2 | 0.228626 |
| 3 | -0.867025 |
| 4 | 1.595389 |
X与Y转化为矩阵,初始化参数θ矩阵
X = np.matrix(X.values)
Y = np.matrix(Y.values)
theta = np.matrix(np.zeros((1,3)))
theta
matrix([[0., 0., 0.]])
df.insert(0,"x_0",1)
print(computeCost(X,Y,theta))##计算一下初始时theta为0的代价函数
0.4893617021276598
def gradientDescent(X,Y,theta,alpha,n):
    jj = np.zeros((n, 3))##用于保存theta的二维数组
    temp = np.matrix(np.zeros(theta.shape))
    s = int(theta.ravel().shape[1])#得到theta矩阵个数
    j_theta = np.zeros(n)
    for i in range(n):
        cost = (X * theta.T) - Y
        for j in range(s):
            term = np.multiply(cost,X[:,j])
            temp[0,j] = theta[0,j] - ((alpha / len(X)) * np.sum(term))
            jj[i][j] = temp[0,j]
        theta = temp
        j_theta[i] = computeCost(X,Y,theta)
    return theta ,j_theta,jj
alpha = 0.01
n = 1000
th,cost,jj = gradientDescent(X,Y,theta,alpha,n)
th
matrix([[-5.54461914e-17, 8.78503652e-01, -4.69166570e-02]])
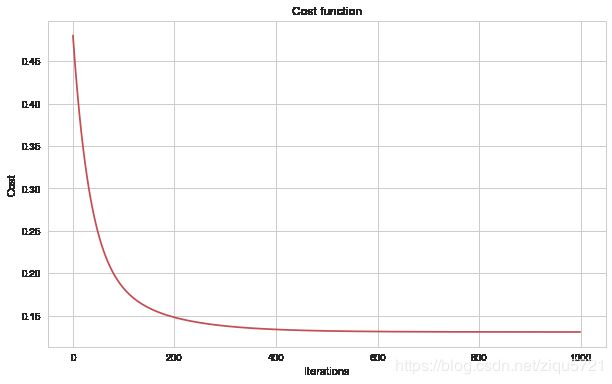
代价函数可视化
代价函数与迭代次数之间的关系
fig, ax = plt.subplots(figsize=(10,6))
ax.plot(np.arange(n), cost, 'r')
ax.set_xlabel('Iterations')
ax.set_ylabel('Cost')
ax.set_title('Cost function')
Text(0.5,1,'Cost function')
2.4 正规方程(Normal Equations)
正规方程是通过求解下面的方程来找出使得代价函数最小的参数的: ∂ ∂ θ j J ( θ j ) = 0 \frac{\partial}{\partial{\theta_{j}}}J\left( {\theta_{j}} \right)=0 ∂θj∂J(θj)=0 。
假设我们的训练集特征矩阵为 X X X(包含了 x 0 = 1 {{x}_{0}}=1 x0=1)并且我们的训练集结果为向量 y y y,则利用正规方程解出向量 θ = ( X T X ) − 1 X T y \theta ={{\left( {X^T}X \right)}^{-1}}{X^{T}}y θ=(XTX)−1XTy 。具体推导过程见本章学习笔记。
# 正规方程
def normal_equation(X, Y):
    theta = np.linalg.inv(X.T*X)*X.T*Y
    return theta
normal_theta = normal_equation(X,Y)
normal_theta
matrix([[-5.55111512e-17],
        [ 8.84765988e-01],
        [-5.31788197e-02]])
