数据科学 案例6 逻辑回归2之 电信客户流失预警案例 (代码)
- 8 逻辑回归
- 1、导入数据和数据清洗
- 2、分类变量的相关关系
- 3、线性回归
- 3.1 数据预处理(字符型转化为数值型,查看变量间的关系)
- 3.2 随机抽样,建立训练集与测试集
- 3.3 线性回归
- 3.4 预测
- 3.5 模型评估
- 1、设定阈值
- 2、混淆矩阵
- 3、计算准确率
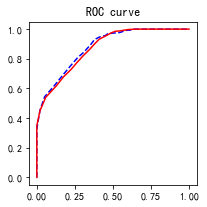
- 4、绘制ROC曲线
- 4、逻辑回归
- 4.1 包含分类预测变量的逻辑回归
- 4.2 多元逻辑回归
- 1、向前法
- 2、计算方差膨胀因子
- 3、岭回归和Lasso算法
- 4、交叉验证
- 5、可视化
- 5、合理的C
- 5、KNN算法
8 逻辑回归
#subscriberID=“个人客户的ID”
#churn=“是否流失:1=流失”;
#Age=“年龄”
#incomeCode=“用户居住区域平均收入的代码”
#duration=“在网时长”
#peakMinAv=“统计期间内最高单月通话时长”
#peakMinDiff=“统计期间结束月份与开始月份相比通话时长增加数量”
#posTrend=“该用户通话时长是否呈现出上升态势:是=1”
#negTrend=“该用户通话时长是否呈现出下降态势:是=1”
#nrProm=“电话公司营销的数量”
#prom=“最近一个月是否被营销过:是=1”
#curPlan=“统计时间开始时套餐类型:1=最高通过200分钟;2=300分钟;3=350分钟;4=500分钟”
#avPlan=“统计期间内平均套餐类型”
#planChange=“统计结束时和开始时套餐的变化:正值代表套餐档次提升,负值代表下降,0代表不变”
#posPlanChange=“统计期间是否提高套餐:1=是”
#negPlanChange=“统计期间是否降低套餐:1=是”
#call_10086=“拨打10086的次数”
import os
import numpy as np
from scipy import stats
import pandas as pd
import statsmodels.api as sm
import statsmodels.formula.api as smf
import matplotlib.pyplot as plt
1、导入数据和数据清洗
accepts = pd.read_csv(r'.\data\telecom_churn.csv',encoding='gbk')
accepts.head()
|
subscriberID |
churn |
gender |
AGE |
edu_class |
incomeCode |
duration |
feton |
peakMinAv |
peakMinDiff |
posTrend |
negTrend |
nrProm |
prom |
curPlan |
avgplan |
planChange |
posPlanChange |
negPlanChange |
call_10086 |
| 0 |
19164958.0 |
1.0 |
0.0 |
20.0 |
2.0 |
12.0 |
16.0 |
0.0 |
113.666667 |
-8.0 |
0.0 |
1.0 |
0.0 |
0.0 |
1.0 |
1.0 |
0.0 |
0.0 |
0.0 |
0.0 |
| 1 |
39244924.0 |
1.0 |
1.0 |
20.0 |
0.0 |
21.0 |
5.0 |
0.0 |
274.000000 |
-371.0 |
0.0 |
1.0 |
2.0 |
1.0 |
3.0 |
2.0 |
2.0 |
1.0 |
0.0 |
1.0 |
| 2 |
39578413.0 |
1.0 |
0.0 |
11.0 |
1.0 |
47.0 |
3.0 |
0.0 |
392.000000 |
-784.0 |
0.0 |
1.0 |
0.0 |
0.0 |
3.0 |
3.0 |
0.0 |
0.0 |
0.0 |
1.0 |
| 3 |
40992265.0 |
1.0 |
0.0 |
43.0 |
0.0 |
4.0 |
12.0 |
0.0 |
31.000000 |
-76.0 |
0.0 |
1.0 |
2.0 |
1.0 |
3.0 |
3.0 |
0.0 |
0.0 |
0.0 |
1.0 |
| 4 |
43061957.0 |
1.0 |
1.0 |
60.0 |
0.0 |
9.0 |
14.0 |
0.0 |
129.333333 |
-334.0 |
0.0 |
1.0 |
0.0 |
0.0 |
3.0 |
3.0 |
0.0 |
0.0 |
0.0 |
0.0 |
2、分类变量的相关关系
2.1 交叉表
cross_table = pd.crosstab(accepts.posTrend,accepts.churn, margins=True)
cross_table
| churn |
0.0 |
1.0 |
All |
| posTrend |
|
|
|
| 0.0 |
829 |
990 |
1819 |
| 1.0 |
1100 |
544 |
1644 |
| All |
1929 |
1534 |
3463 |
2.2 列联表
def percConvert(ser):
return ser/float(ser[-1])
cross_table = pd.crosstab(accepts.posTrend,accepts.churn, margins=True)
cross_table.apply(percConvert, axis=1)
| churn |
0.0 |
1.0 |
All |
| posTrend |
|
|
|
| 0.0 |
0.455745 |
0.544255 |
1.0 |
| 1.0 |
0.669100 |
0.330900 |
1.0 |
| All |
0.557031 |
0.442969 |
1.0 |
print('''chisq = %6.4f
p-value = %6.4f
dof = %i
expected_freq = %s'''  %stats.chi2_contingency(cross_table.iloc[:2, :2]))
chisq = 158.4433
p-value = 0.0000
dof = 1
expected_freq = [[1013.24025411  805.75974589]
 [ 915.75974589  728.24025411]]
3、线性回归
3.1 数据预处理(字符型转化为数值型,查看变量间的关系)
plt.rcParams['font.sans-serif'] = [u'SimHei']
plt.rcParams['axes.unicode_minus'] = False
accepts.plot(x = 'duration',y = 'churn', kind = 'scatter')

3.2 随机抽样,建立训练集与测试集
train = accepts.sample(frac=0.7, random_state=1234).copy()
test = accepts[~ accepts.index.isin(train.index)].copy()
print(' 训练集样本量: %i \n 测试集样本量: %i' %(len(train), len(test)))
 训练集样本量: 2424
 测试集样本量: 1039
3.3 线性回归
lg = smf.glm('churn ~ duration', data=train,
family=sm.families.Binomial(sm.families.links.logit)).fit()
lg.summary()
Generalized Linear Model Regression Results
| Dep. Variable: |
churn |
No. Observations: |
2424 |
| Model: |
GLM |
Df Residuals: |
2422 |
| Model Family: |
Binomial |
Df Model: |
1 |
| Link Function: |
logit |
Scale: |
1.0000 |
| Method: |
IRLS |
Log-Likelihood: |
-1068.0 |
| Date: |
Thu, 20 Feb 2020 |
Deviance: |
2136.0 |
| Time: |
10:35:15 |
Pearson chi2: |
1.93e+03 |
| No. Iterations: |
7 |
Covariance Type: |
nonrobust |
|
coef |
std err |
z |
P>|z| |
[0.025 |
0.975] |
| Intercept |
2.5488 |
0.118 |
21.575 |
0.000 |
2.317 |
2.780 |
| duration |
-0.2422 |
0.011 |
-22.199 |
0.000 |
-0.264 |
-0.221 |
3.4 预测
train['proba'] = lg.predict(train)
test['proba'] = lg.predict(test)

test['proba'].head(10)
3     0.411422
5     0.591125
7     0.701216
8     0.792090
10    0.531554
12    0.531554
15    0.252598
16    0.860811
23    0.648136
26    0.003377
Name: proba, dtype: float64
3.5 模型评估
1、设定阈值
test['prediction'] = (test['proba'] > 0.5).astype('int')
2、混淆矩阵
pd.crosstab(test.churn, test.prediction, margins=True)
| prediction |
0 |
1 |
All |
| churn |
|
|
|
| 0.0 |
427 |
156 |
583 |
| 1.0 |
88 |
368 |
456 |
| All |
515 |
524 |
1039 |
3、计算准确率
acc = sum(test['prediction'] == test['churn']) /np.float(len(test))
print('The accurancy is %.2f' %acc)
The accurancy is 0.77
for i in np.arange(0.1, 0.9, 0.1):
prediction = (test['proba'] > i).astype('int')
confusion_matrix = pd.crosstab(prediction,test.churn,
margins = True)
precision = confusion_matrix.loc[0, 0] /confusion_matrix.loc['All', 0]
recall = confusion_matrix.loc[0, 0] / confusion_matrix.loc[0, 'All']
Specificity = confusion_matrix.loc[1, 1] /confusion_matrix.loc[1,'All']
f1_score = 2 * (precision * recall) / (precision + recall)
print('threshold: %s, precision: %.2f, recall:%.2f ,Specificity:%.2f , f1_score:%.2f'%(i, precision, recall, Specificity,f1_score))
threshold: 0.1, precision: 0.44, recall:0.97 ,Specificity:0.58 , f1_score:0.61
threshold: 0.2, precision: 0.53, recall:0.96 ,Specificity:0.62 , f1_score:0.69
threshold: 0.30000000000000004, precision: 0.59, recall:0.93 ,Specificity:0.64 , f1_score:0.72
threshold: 0.4, precision: 0.65, recall:0.89 ,Specificity:0.66 , f1_score:0.75
threshold: 0.5, precision: 0.73, recall:0.83 ,Specificity:0.70 , f1_score:0.78
threshold: 0.6, precision: 0.83, recall:0.77 ,Specificity:0.76 , f1_score:0.80
threshold: 0.7000000000000001, precision: 0.88, recall:0.75 ,Specificity:0.81 , f1_score:0.81
threshold: 0.8, precision: 1.00, recall:0.66 ,Specificity:1.00 , f1_score:0.79
4、绘制ROC曲线
import sklearn.metrics as metrics

fpr_test, tpr_test, th_test = metrics.roc_curve(test.churn, test.proba)
fpr_train, tpr_train, th_train = metrics.roc_curve(train.churn, train.proba)

plt.figure(figsize=[3, 3])
plt.plot(fpr_test, tpr_test, 'b--')
plt.plot(fpr_train, tpr_train, 'r-')
plt.title('ROC curve')
plt.show()
print('AUC = %.4f' %metrics.auc(fpr_test, tpr_test))

AUC = 0.8790
4、逻辑回归
4.1 包含分类预测变量的逻辑回归
4.2 多元逻辑回归
1、向前法
def forward_select(data, response):
    remaining = set(data.columns)
    remaining.remove(response)
    selected = []
    current_score, best_new_score = float('inf'), float('inf')
    while remaining:
        aic_with_candidates=[]
        for candidate in remaining:
            formula = "{} ~ {}".format(
                response,' + '.join(selected + [candidate]))
            aic = smf.glm(
                formula=formula, data=data,
                family=sm.families.Binomial(sm.families.links.logit)
            ).fit().aic
            aic_with_candidates.append((aic, candidate))
        aic_with_candidates.sort(reverse=True)
        best_new_score, best_candidate=aic_with_candidates.pop()
        if current_score > best_new_score:
            remaining.remove(best_candidate)
            selected.append(best_candidate)
            current_score = best_new_score
            print ('aic is {},continuing!'.format(current_score))
        else:
            print ('forward selection over!')
            break

    formula = "{} ~ {} ".format(response,' + '.join(selected))
    print('final formula is {}'.format(formula))
    model = smf.glm(
        formula=formula, data=data,
        family=sm.families.Binomial(sm.families.links.logit)
    ).fit()
    return(model)
candidates = ['churn','duration','AGE','edu_class','posTrend','negTrend',\
'nrProm','prom','curPlan','avgplan','planChange','incomeCode',\
'feton','peakMinAv','peakMinDiff','call_10086']
data_for_select = train[candidates]
lg_m1 = forward_select(data=data_for_select, response='churn')
lg_m1.summary()
aic is 2139.9815513388403,continuing!
aic is 2015.2487668432518,continuing!
aic is 1950.666516634723,continuing!
aic is 1903.4002638032448,continuing!
aic is 1860.4602993108329,continuing!
aic is 1833.4423541609135,continuing!
aic is 1827.3343077471563,continuing!
aic is 1818.8478080369655,continuing!
aic is 1816.0480740672483,continuing!
aic is 1809.388996677547,continuing!
aic is 1806.4687346433138,continuing!
forward selection over!
final formula is churn ~ duration + feton + peakMinDiff + call_10086 + edu_class + AGE + prom + nrProm + posTrend + negTrend + peakMinAv
Generalized Linear Model Regression Results
| Dep. Variable: |
churn |
No. Observations: |
2424 |
| Model: |
GLM |
Df Residuals: |
2412 |
| Model Family: |
Binomial |
Df Model: |
11 |
| Link Function: |
logit |
Scale: |
1.0000 |
| Method: |
IRLS |
Log-Likelihood: |
-891.23 |
| Date: |
Thu, 20 Feb 2020 |
Deviance: |
1782.5 |
| Time: |
10:35:38 |
Pearson chi2: |
1.93e+03 |
| No. Iterations: |
7 |
Covariance Type: |
nonrobust |
|
coef |
std err |
z |
P>|z| |
[0.025 |
0.975] |
| Intercept |
5.1489 |
0.456 |
11.298 |
0.000 |
4.256 |
6.042 |
| duration |
-0.2683 |
0.013 |
-20.387 |
0.000 |
-0.294 |
-0.242 |
| feton |
-1.2546 |
0.121 |
-10.367 |
0.000 |
-1.492 |
-1.017 |
| peakMinDiff |
-0.0024 |
0.000 |
-4.922 |
0.000 |
-0.003 |
-0.001 |
| call_10086 |
-0.7969 |
0.120 |
-6.647 |
0.000 |
-1.032 |
-0.562 |
| edu_class |
0.4931 |
0.075 |
6.613 |
0.000 |
0.347 |
0.639 |
| AGE |
-0.0207 |
0.004 |
-4.720 |
0.000 |
-0.029 |
-0.012 |
| prom |
2.1936 |
0.660 |
3.326 |
0.001 |
0.901 |
3.486 |
| nrProm |
-0.6564 |
0.236 |
-2.776 |
0.006 |
-1.120 |
-0.193 |
| posTrend |
-1.5331 |
0.404 |
-3.797 |
0.000 |
-2.325 |
-0.742 |
| negTrend |
-1.2694 |
0.402 |
-3.161 |
0.002 |
-2.056 |
-0.482 |
| peakMinAv |
0.0010 |
0.000 |
2.203 |
0.028 |
0.000 |
0.002 |
2、计算方差膨胀因子
def vif(df, col_i):
from statsmodels.formula.api import ols
cols = list(df.columns)
cols.remove(col_i)
cols_noti = cols
formula = col_i + '~' + '+'.join(cols_noti)
r2 = ols(formula, df).fit().rsquared
return 1. / (1. - r2)
exog = train[candidates].drop(['churn'], axis=1)
for i in exog.columns:
print(i, '\t', vif(df=exog, col_i=i))
duration 	 1.1649188214231452
AGE 	 1.060405955441583
edu_class 	 1.091937406580932
posTrend 	 10.87998721692619
negTrend 	 10.799093191856452
nrProm 	 10.594010492273254
prom 	 10.642709479318954
curPlan 	 228.06562536008082
avgplan 	 224.90961280080845
planChange 	 3.8781006983584954
incomeCode 	 1.0331700826612906
feton 	 1.032150079222362
peakMinAv 	 1.237319425737561
peakMinDiff 	 1.758824465225615
call_10086 	 1.027704090678157
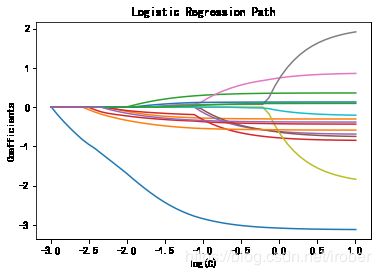
3、岭回归和Lasso算法
(对最初的标准线性回归做一定的变化使原先无法求逆的矩阵变得非奇异,使得问题可以稳定求解。)
二分类:Logistic regression
多分类:Softmax分类函数
逻辑回归强烈推荐
from sklearn.linear_model import LogisticRegression
from sklearn.preprocessing import StandardScaler
candidates = ['duration','AGE','edu_class','posTrend','negTrend','nrProm','prom','curPlan','avgplan','planChange','incomeCode','feton','peakMinAv','peakMinDiff','call_10086']
scaler = StandardScaler()
X = scaler.fit_transform(accepts[candidates])
y = accepts['churn']
from sklearn import linear_model
from sklearn.svm import l1_min_c
cs = l1_min_c(X, y, loss='log') * np.logspace(0, 4)
print("Computing regularization path ...")
clf = linear_model.LogisticRegression(C=1.0, solver='liblinear',penalty='l1',tol=1e-6,max_iter =500)
coefs_ = []
for c in cs:
clf.set_params(C=c)
clf.fit(X, y)
coefs_.append(clf.coef_.ravel().copy())
coefs_ = np.array(coefs_)
plt.plot(np.log10(cs), coefs_)
ymin, ymax = plt.ylim()
plt.xlabel('log(C)')
plt.ylabel('Coefficients')
plt.title('Logistic Regression Path')
plt.axis('tight')
plt.show()
Computing regularization path ...

d:\Anaconda3\lib\site-packages\sklearn\svm\base.py:931: ConvergenceWarning: Liblinear failed to converge, increase the number of iterations.
  "the number of iterations.", ConvergenceWarning)

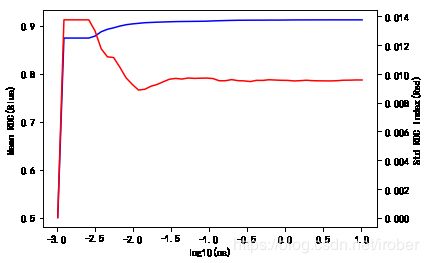
4、交叉验证
cs = l1_min_c(X, y, loss='log') * np.logspace(0, 4)
import matplotlib.pyplot as plt
from sklearn.model_selection import cross_val_score
import warnings
warnings.filterwarnings("ignore")
k_scores = []
clf = linear_model.LogisticRegression(penalty='l1')
for c in cs:
clf.set_params(C=c)
scores = cross_val_score(clf, X, y, cv=10, scoring='roc_auc')
k_scores.append([c,scores.mean(),scores.std()])
5、可视化
data=pd.DataFrame(k_scores)
fig = plt.figure()
ax1 = fig.add_subplot(111)
ax1.plot(np.log10(data[0]), data[1],'b')
ax1.set_ylabel('Mean ROC(Blue)')
ax1.set_xlabel('log10(cs)')
ax2 = ax1.twinx()
ax2.plot(np.log10(data[0]), data[2],'r')
ax2.set_ylabel('Std ROC Index(Red)')
Text(0, 0.5, 'Std ROC Index(Red)')

5、合理的C
from sklearn.linear_model import LogisticRegression
from sklearn.preprocessing import StandardScaler
candidates = ['duration','AGE','edu_class','posTrend','negTrend','nrProm','prom','curPlan','avgplan','planChange','incomeCode','feton','peakMinAv','peakMinDiff','call_10086']
scaler = StandardScaler()
X = scaler.fit_transform(accepts[candidates])
y = accepts['churn']
from sklearn import linear_model

clf = linear_model.LogisticRegression(C=np.exp(-1.9), penalty='l1')
clf.fit(X, y)
clf.coef_
array([[-2.91550192, -0.28678388,  0.31940015, -0.47182529, -0.29610763,
        -0.24445793,  0.33416986,  0.06622358,  0.        ,  0.        ,
         0.12293815, -0.5545222 ,  0.06489269, -0.3879872 , -0.35258674]])
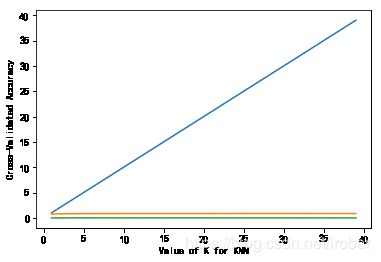
5、KNN算法
from sklearn.neighbors import KNeighborsClassifier
k_range = range(1, 40)
k_scores = []
for k in k_range:
knn = KNeighborsClassifier(n_neighbors=k)
scores = cross_val_score(knn, X, y, cv=3, scoring='roc_auc')
k_scores.append([k,scores.mean(),scores.std()])
plt.plot(k_range, k_scores)
plt.xlabel('Value of K for KNN')
plt.ylabel('Cross-Validated Accuracy')
plt.show()


