(kaggle)Video Game Sales电子游戏销售分析
模块导入
项目介绍
项目来源:kaggle
项目介绍:由vgchartz.com的一个刮版生成的,有一份综合的游戏行业销售数据,希望产生一份综合的游戏行业报告
数据介绍:包含游戏名称、类型、发行时间、发布者以及在全球各地的销售额数据。
字段包括
RANK-总销售额的排名
Name-游戏的名字
Platform-游戏发布平台(即PC,PS4等)
Year-游戏发行的年份
Genre-游戏的类型
Publisher-游戏的出版者
NA_Sales -北美销售额(百万)
EU_Sales -欧洲销售额(百万)
JP_Sales -日本销售额(百万)
Other_Sales—世界其他地区销售额(百万)
Global_Sales—全球销售总额。
适用场景:电商、游戏销售,常规销售数据。
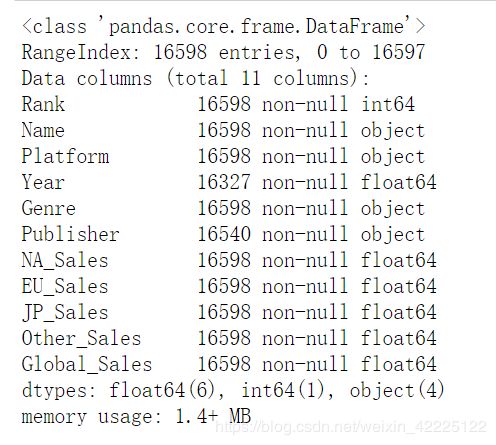
数据量:11列共1.66W数据量。
python:3.7.1
from IPython.core.interactiveshell import InteractiveShell
InteractiveShell.ast_node_interactivity = "all"
import numpy as np
import pandas as pd
import seaborn as sns
import matplotlib.pyplot as plt
import pyecharts
import datetime
%matplotlib inline

plt.rcParams['font.sans-serif']=['SimHei']  # 用来正常显示中文标签
plt.rcParams['axes.unicode_minus']=False  # 用来正常显示负号

#警告删除
import warnings
warnings.simplefilter(action="ignore", category=FutureWarning)

#画图风格
plt.style.use("fivethirtyeight")

import seaborn as sns
# sns.set(style="white")
# sns.set(style="whitegrid", color_codes=True)
#导入数据
df = pd.read_csv('vgsales.csv')
描述性分析
df.info()
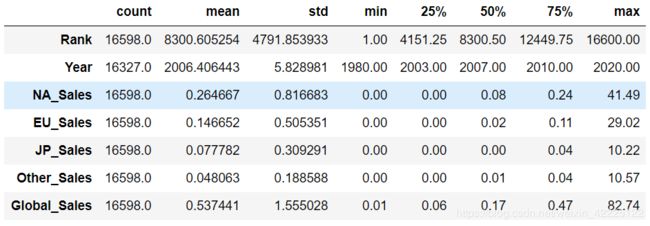
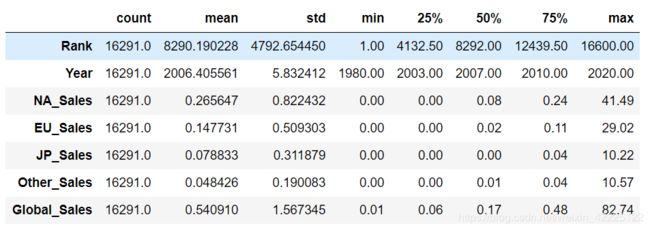
- 几大市场中北美市场的平均销量最高,销量最大值也最高
- 日本市场均销量最低,销量最大值也最低,且截止到四分卫数的时候也只有0.04
- 三大市场都存在分布极度不均匀的情况
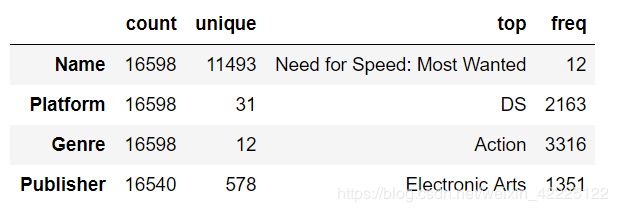
df.describe(include = 'object').T
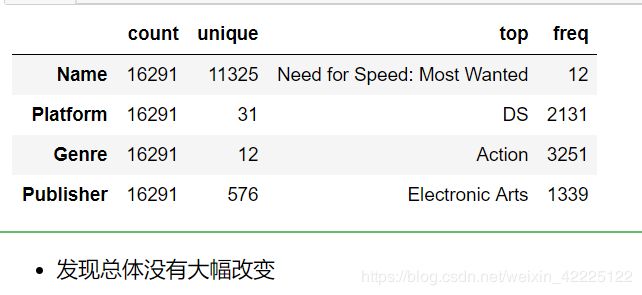
- 一共有31个游戏平台,12个游戏类型
- 578个发行商
Data Processing
df.head()
df[df['Publisher'].isnull()|df['Year'].isnull()].shape
- 发现空值总行为307,总行数为16598,占比只有百分之1.8%
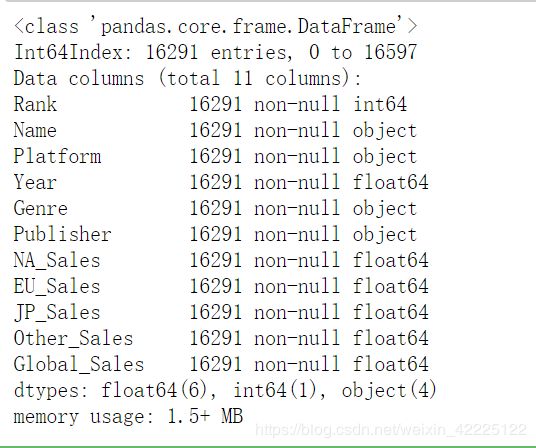
- 所以可以执行删除操作不会影响平衡
df.dropna(how='any',inplace=True)
df.info()
df.describe().T
df.describe(include='object').T
EDA
1.用户喜好方向
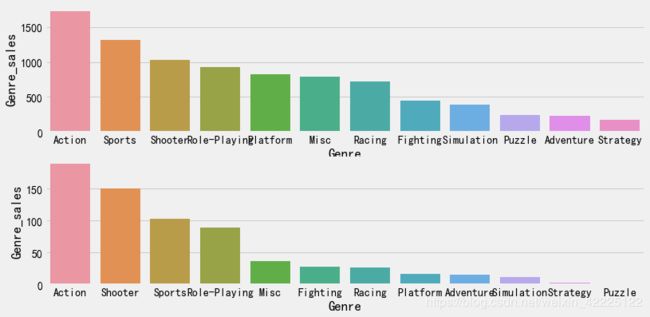
用户长久最喜欢的游戏类型是?这种趋势最近是否发生了变化?
FGE=pd.pivot_table(df,index='Year',columns='Genre',values='Global_Sales',aggfunc=np.sum).sum().sort_values(ascending=False)
FGE=pd.DataFrame(data=FGE,columns={'Genre_sales'})
FGE_near5=pd.pivot_table(df,index='Year',columns='Genre',values='Global_Sales',aggfunc=np.sum).iloc[-5:,:].sum().sort_values(ascending=False)
FGE_near5=pd.DataFrame(data=FGE_near5,columns={'Genre_sales'})
fig,(ax1,ax2)=plt.subplots(2,1,figsize=(12,6))
sns.barplot(x=FGE.index,y='Genre_sales',data=FGE,ax=ax1)
sns.barplot(x=FGE_near5.index,y='Genre_sales',data=FGE_near5,ax=ax2)
- 可看出最近五年用户最喜爱的游戏类型依然还是动作类
- 运动类和射击类地位互换了
- 横板类(Platform)可能由于3D游戏技术的发展渐渐淡出视野
- 悬疑类大降,原因未知
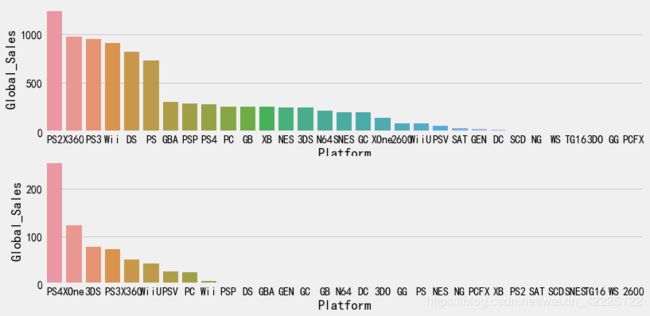
用户最喜欢的游戏平台是什么?这种趋势最近是否发生了变化?
FPF=pd.pivot_table(df,index='Year',columns='Platform',values='Global_Sales',aggfunc=np.sum).sum().sort_values(ascending=False)
FPF=pd.DataFrame(data=FPF,columns={'Global_Sales'})
FPF_near5=pd.pivot_table(df,index='Year',columns='Platform',values='Global_Sales',aggfunc=np.sum).iloc[-5:,:].sum().sort_values(ascending=False)
FPF_near5=pd.DataFrame(data=FPF_near5,columns={'Global_Sales'})
fig,(ax1,ax2)=plt.subplots(2,1,figsize=(12,6))
sns.barplot(x=FPF.index,y='Global_Sales',data=FPF,ax=ax1)
sns.barplot(x=FPF_near5.index,y='Global_Sales',data=FPF_near5,ax=ax2)
- 总体可以看出,时代的发展直接体现在技术上的变革,大部分不支持最新游戏的老版平台都被慢慢淘汰了
- PS2不见踪影,PS4独占鳌头,DS和3DS的情况如出一辙
- 老牌平台之间被新版平台排斥,X360仍在坚守
- 令我吃惊的是Wli居然垮得这么恼火
2.企业方向
前五发行商的销售情况以及近年来的总体变化
PBL=pd.pivot_table(data=df,index='Publisher',values='Global_Sales',aggfunc=np.sum)
PBL=PBL.sort_values(by='Global_Sales',ascending=False)
PBL_near5=df[df['Year']>2013]
PBL_near5=pd.pivot_table(data=PBL_near5,index='Publisher',values='Global_Sales',aggfunc=np.sum)
PBL_near5=PBL_near5.sort_values(by='Global_Sales',ascending=False)
from pyecharts import Pie
pie = Pie("发行商饼状图", "长短期对比分析",title_pos='right',width=900,height=300)
pie.add("长期", PBL.head().index, PBL.head().values ,center=[25,50],is_legend_show=False,is_label_show=True)
pie.add("短期", PBL_near5.head().index, PBL_near5.head().values ,center=[75,50],is_legend_show=False,is_label_show=True)
#保存图表
pie
- 索尼最近几年乏力
- 育碧稳步提升
- 任天堂地位不倒,但比重下降
- EA,暴雪风韵犹存
3.市场方向
游戏市场的总体发展趋势
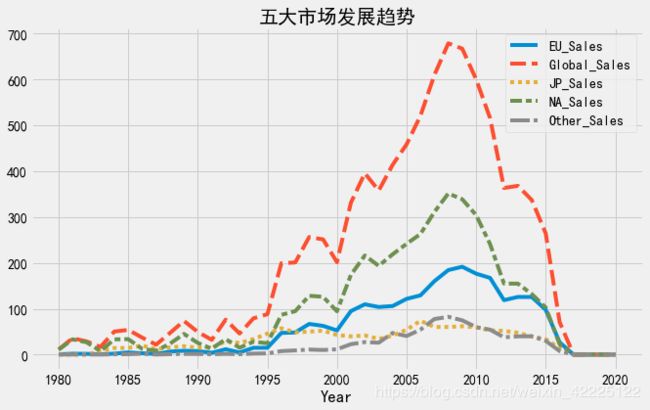
M=['NA_Sales','EU_Sales','JP_Sales','Other_Sales','Global_Sales']
#绘制各地区销量走势图
df5market_p=pd.pivot_table(df,index='Year',values=M,aggfunc=np.sum)
fig=plt.figure(figsize=(10,6))
sns.lineplot(data=df5market_p)
plt.title('五大市场发展趋势')
- 可看出,从1995年销量开始暴涨
- 2005-2010间数据达到峰值
- 但是2015年后又开始狂跌
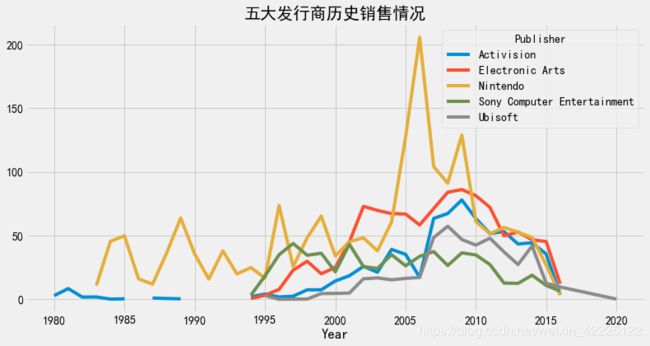
销量趋势惨不忍睹,是因为龙头不行还是总体不行呢,我们看五大发行商的历史销售情况
P=['Nintendo','Electronic Arts','Activision','Sony Computer Entertainment','Ubisoft']
df5PBL=df[df['Publisher'].isin(P)]
df5PBL_p=pd.pivot_table(data=df5PBL,index='Year',columns='Publisher',values='Global_Sales',aggfunc=np.sum)
df5PBL_p.plot(title='五大发行商历史销售情况',figsize=(12,6))
- 任天堂在2006年左右赢来了一次大爆发
- 其他发行商在这个节点反而下降了
- 2007年左右任天堂又被其他发行商迅速抢回市场份额
- 在2009年左右任天堂最后一次反扑之后和其他发行商一起下滑
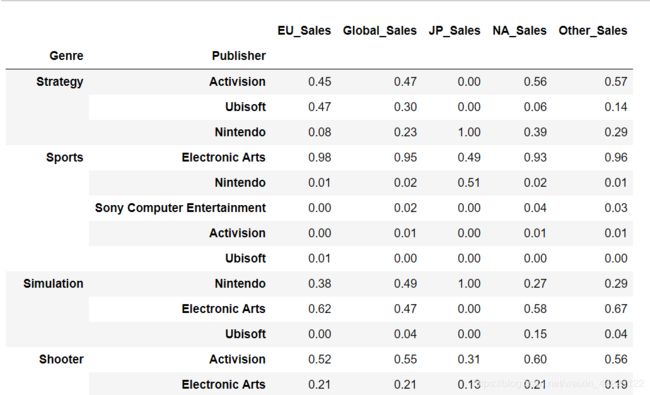
那么这五家厂商他们专精的领域是什么类型的游戏呢?各自又在什么市场有主导地位呢?
df5PBL_G_M_p=pd.pivot_table(data=df5PBL,index=['Genre','Publisher'],values=M,aggfunc=np.sum)
df5PBL_G_M_p.sort_values(by=['Genre','Global_Sales'],ascending=False).head() #这里必须对Genre排序不然会乱,只能对Genre分组
df5PBL_G_M_p_pct=df5PBL_G_M_p.div(df5PBL_G_M_p.groupby(level=0).sum()).round(2)
df5PBL_G_M_p_pct=df5PBL_G_M_p_pct.sort_values(by=['Genre','Global_Sales'],ascending=False)
df5PBL_G_M_p_pct
- 任天堂任然处于龙头地位,在大部分领域占比第一
- EA则在运动和模拟领域站住了脚跟
- 射击领域暴雪一马当先
- 动作领域育碧和暴雪持平
近年来五大发行商的市场占额又是如何呢?
PBL_near5_5p=df[(df['Year']>2013)&(df['Publisher'].isin(P))]
PBL_near5_5p_G_M_p=pd.pivot_table(data=PBL_near5_5p,index=['Genre','Publisher'],values=M,aggfunc=np.sum)
PBL_near5_5p_G_M_p_pct=PBL_near5_5p_G_M_p.div(PBL_near5_5p_G_M_p.groupby(level=0).sum()).round(2)
PBL_near5_5p_G_M_p_pct=PBL_near5_5p_G_M_p_pct.sort_values(by=['Genre','Global_Sales'],ascending=False)
PBL_near5_5p_G_M_p_pct
- 任天堂地位不倒
- EA垄断运动领域
- 暴雪在策略,射击,冒险类中比较突出
- 育碧则占据了动作和新领域音乐类的大部分市场
- 索尼市场分布一直比较均衡
建模预测
假如我是暴雪(妹想到有朝一日我也能为部落而战),现在要发行一款名为’Oligay’的真人射击游戏,预测一下在五大市场的2020年销售额以及总排名,怎么做?(是的 没有错 干了奥里给)
1.首先我们要提取出所有暴雪在射击领域的所有数据
A_S =df[(df['Year']<2020)&(df['Genre']=='Shooter')&(df['Publisher']=='Activision')]
A_S.head()
A_S_p=pd.pivot_table(data=A_S,index='Year',values=M,aggfunc=np.sum) #由于要汇总每年的数据所以只有暂时抛弃掉Platform
A_S_p.head()
A_S_p.index=A_S_p.index.astype(str)
A_S_p.index=A_S_p.index.str.replace('\.0','')
A_S_p.index
A_S_p['Date_Time'] = pd.to_datetime(A_S_p.index)
A_S_p.index = A_S_p.Date_Time
A_S_p.drop(['Date_Time'],axis=1,inplace=True)
A_S_p.tail()
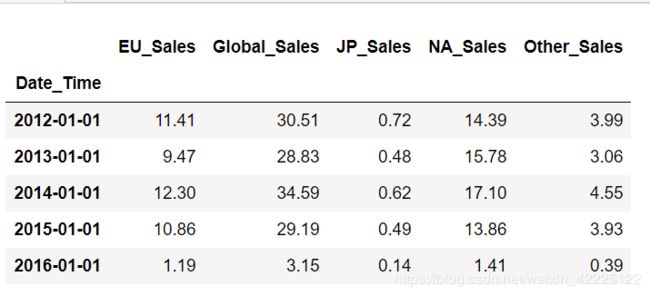
基础样本做好了,之后我的思路是,对五大市场的销售额依据新做的Date_Time进行时间序列预测,然后再预测新游戏’oligay’的排名
由于是时间序列数据所以我们不能随机切分训练与验证集要按照时间来
train = A_S_p[:int(0.8*(len(A_S_p)))]
valid = A_S_p[int(0.8*(len(A_S_p))):]

from statsmodels.tsa.vector_ar.var_model import VAR
model = VAR(endog=train)
model_fit = model.fit()

prediction = model_fit.forecast(model_fit.y, steps=len(valid))

model = VAR(endog=A_S_p)
model_fit = model.fit()
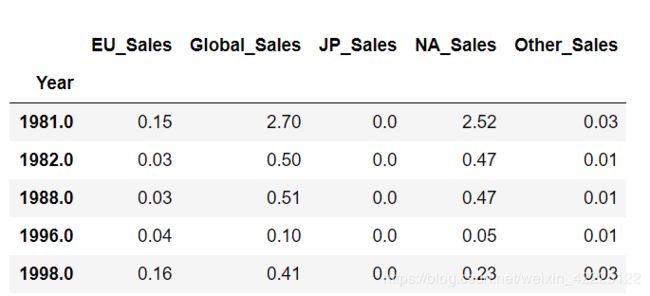
yhat = model_fit.forecast(model_fit.y, steps=1)
print(yhat)
![]()
发现结果并不理想,应该是时间序列的各项调整还没有加入的原因(pdf检验,平稳性处理等),还有关于市场的切入,营销的做法也没有写,有时间再搞,我大奥力给不能灭亡(手动狗头…
数据分析新人,希望巨佬不吝赐教
