傅里叶级数拟合实验
这是11月研究matplotlib的成果,顺便复习了一下高数。
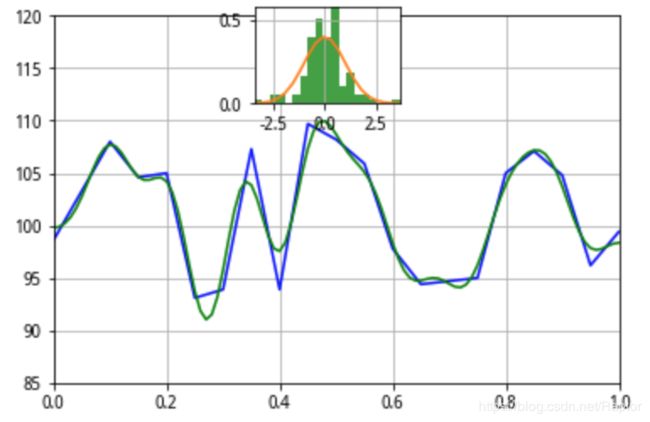
下面是程序的运行结果,蓝色为随机生成的源数据,绿色为用傅里叶级数(19项)拟合的结果,效果还是蛮好的。中间上方的小图为误差分布,接近标准正态分布。
程序中比较复杂的部分都是数学计算有关的,一个是傅里叶级数展开的方程组生成——通过源数据作最小二乘拟合;另一个是用高斯消元法解这个方程组,得到傅里叶级数的系数。其它就是调用matplotlib作图了。
本程序没有什么实际意义,纯属写着玩的。^O^
以下代码可在Jupyter Notebook里运行看效果。
import matplotlib.pyplot as plt
from scipy.stats import norm
import random


def Sigma( func, size ) :
	c = 0
	for i in range(size) :
		c = c + func( i )
	return c

# ordinary least squares to Fourier级数
# Xlist and Ylist are some points
# restul is a matrix include cnSyntonicX(cnSyntonic+1) items
def ols2fourier( Xlist, Ylist, cnSyntonic ) :
	cnPoints = len( Ylist )
	line = []
	line.append( Sigma( lambda x : 0.5, cnPoints ) / 2 )
	for j in range(1, cnSyntonic) :
		line.append( Sigma( lambda x : math.cos( Xlist[x] * j * math.pi ) / 2, cnPoints ) )
	line.append( Sigma( lambda x : Ylist[x] / 2, cnPoints ) )
	result = []
	result.append( line )
	for n in range(1, cnSyntonic) :
		line = []
		line.append( Sigma( lambda x : math.cos( Xlist[x] * n * math.pi ), cnPoints ) / 2 )
		for j in range(1, cnSyntonic) :
			line.append( Sigma( lambda x : math.cos( Xlist[x] * j * math.pi ) * math.cos( Xlist[x] * n * math.pi ), cnPoints ) )
		line.append( Sigma( lambda x : Ylist[x] * math.cos( Xlist[x] * n * math.pi ), cnPoints ) )
		result.append( line )
	return result

# used by gauss function
# 列主元消去
def mainitem( matrix, index ) :
	c = 0
	mi = 0
	for i in range( index, len( matrix ) ) :
		t = abs( matrix[i][index] )
		if t > c :
			c = t
			mi = i
	if mi != index :
		matrix[mi], matrix[index] = matrix[index], matrix[mi]

# Gauss消元法
# matrix为线性非齐次方程组的增广矩阵
def gauss( matrix ) :
	cnSyntonic = len( matrix )
	for i in range( cnSyntonic - 1 ) :
		mainitem( matrix, i )
		for j in range( i + 1, cnSyntonic ) :
			k = -matrix[i][i] / matrix[j][i]
			matrix[j][i] = 0
			for n in range( i + 1, cnSyntonic + 1 ) :
				matrix[j][n] = matrix[j][n] * k + matrix[i][n]
	r = list(range( cnSyntonic ))
	r.reverse()
	for i in r :
		for j in range( i + 1, cnSyntonic ) :
			matrix[i][cnSyntonic] = matrix[i][cnSyntonic] - matrix[i][j] * matrix[j][cnSyntonic]
		matrix[i][cnSyntonic] = matrix[i][cnSyntonic] / matrix[i][i]
	result = []
	for i in range( cnSyntonic ) :
		result.append( matrix[i][cnSyntonic] )
	return result

def funcvallist( Xlist, func ) :
	result = []
	for i in range( len( Xlist ) ) :
		result.append( func( Xlist[i] ) )
	return result

# Fourier级数求值
def fourierval( coeff, Xlist ) :
	return funcvallist( Xlist, lambda xitem : coeff[0] / 2 + Sigma( lambda x : coeff[x + 1] * math.cos( xitem * ( x + 1 ) * math.pi ), len( coeff ) - 1 ) )

xsrc  = np.arange( 0, 1.001, 0.01 )
ysrc = []
for i in range(21) :
    ysrc.append( random.randint( 900, 1100 ) / 10.0 )
points = []
for i in range(20) :
    for j in range(5) :
        points.append( ( ysrc[i + 1] - ysrc[i] ) * j / 5 + ysrc[i] )
points.append( ysrc[20] )
plt.plot( xsrc, points, "b" )
matrix = ols2fourier( xsrc, points, 19 )
coefficient = gauss( matrix )
ydest = fourierval( coefficient, xsrc )
plt.plot( xsrc, ydest, "g" )
plt.axis( [0, 1, 85, 120] )
plt.grid( True )

diff = []
for i in range( len( ydest ) ) :
    diff.append( ydest[i] - points[i] )
a = plt.axes( [ .4, .7, 0.2, 0.2 ]) # , axisbg='y' )
n, bins, patches = plt.hist( diff, 19, density=1 )
plt.setp( patches, 'facecolor', 'g', 'alpha', 0.75 )
y = norm.pdf( bins, 0, 1)
l = plt.plot(bins, y)
plt.axis( [min(diff), max(diff), 0, max( [max(n), max(y)] ) ] )
plt.grid( True )
