R语言 一元线性回归、多元线性、多项式回归
关注微信号:小程在线
关注CSDN博客:程志伟的博客
R版本:3.6.1
本节主要介绍了一元线性回归、多元线性、多项式回归。
重点介绍了summary里面每个参数的意义;
创建训练集、测试集;
多项式poly()函数以及I()函数的使用。
###########一元线性回归#############
> library(MASS)
> data(Boston) # 506 obs and 14 variables
> names(Boston)
[1] "crim" "zn" "indus" "chas" "nox" "rm" "age"
[8] "dis" "rad" "tax" "ptratio" "black" "lstat" "medv"
使用 lm()来拟合数据模型
> lm1 <- lm(medv ~ rm, data=Boston)
> lm1
Call:
lm(formula = medv ~ rm, data = Boston)
Coefficients:
(Intercept) rm
-34.671 9.102
> summary(lm1)
Call:
lm(formula = medv ~ rm, data = Boston)
Residuals:
Min 1Q Median 3Q Max
-23.346 -2.547 0.090 2.986 39.433
Coefficients:
Estimate Std. Error t value Pr(>|t|)
(Intercept) -34.671 2.650 -13.08 <2e-16 ***
rm 9.102 0.419 21.72 <2e-16 ***
---
Signif. codes: 0 ‘***’ 0.001 ‘**’ 0.01 ‘*’ 0.05 ‘.’ 0.1 ‘ ’ 1
Residual standard error: 6.616 on 504 degrees of freedom
Multiple R-squared: 0.4835, Adjusted R-squared: 0.4825
F-statistic: 471.8 on 1 and 504 DF, p-value: < 2.2e-16
#Estimate 表示估计系数
# Std. Error表示估计系数的差异性,这个值要比估计系数小一个数量级
#t value 表示用于变量的回归系数是否对模型有帮助
#Pr(>|t|) 变量之间不相关的概率,这个值越小越好
# **** 表示显著性,*越多越显著
> summary(lm1)$coefficients
Estimate Std. Error t value Pr(>|t|)
(Intercept) -34.670621 2.6498030 -13.08423 6.950229e-34
rm 9.102109 0.4190266 21.72203 2.487229e-74
#残差是正态分布的,意味着预测值和实际值之间的差异接近 0
> summary(lm1)$residuals[1:20]
1 2 3 4 5 6 7
-1.1757458 -2.1740210 3.9719677 4.3740621 5.8178479 4.8440600 2.8487416
8 9 10 11 12 13 14
5.5924041 -0.0833549 -1.0784415 -8.3735282 -1.1239521 2.7683010 0.9221744
15 16 17 18 19 20
-2.6158356 1.4689170 3.7496040 -2.3510120 5.2095142 0.7428426
#评估模型拟合得好不好的标准,决定系数为 1 时,拟合程度最好
> summary(lm1)$r.squared
[1] 0.4835255
#如果值超过 1,意味着它们之间有关联
> summary(lm1)$fstatistic
value numdf dendf
471.8467 1.0000 504.0000
#线性模型 lm1 使用 predict()函数
> newdata <- data.frame(rm=6)
> predict(lm1, newdata)
1
19.94203
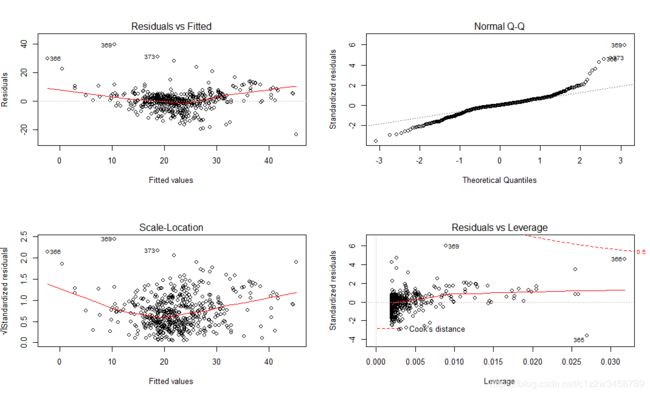
#第一张图是标准的残差曲线图,展示了拟合值下的残差。一些趋于异常值的点在图中标注了出来
#第二张图是残差的正态百分位数图,残差是正态分布的
#最后一张图展示了残差 vs.杠杆比率。在这张图中有标记的点表示我们可能想要审查的可疑情况
> par(mfrow=c(2,2))
> plot(lm1)
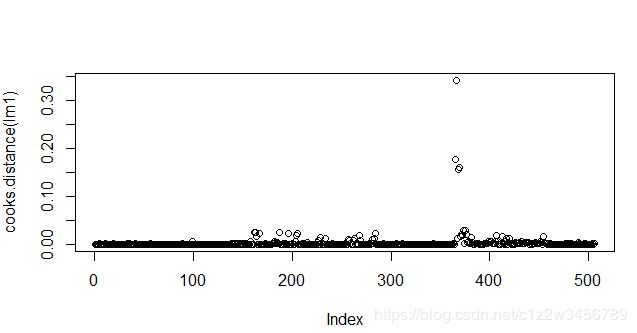
#cook距离可以看出数据点的异常值
> par(mfrow=c(1,1))
> plot(cooks.distance(lm1))
> ###########多元线性回归#################
> library(car)
> data(Prestige)
> summary(Prestige)
education income women prestige
Min. : 6.380 Min. : 611 Min. : 0.000 Min. :14.80
1st Qu.: 8.445 1st Qu.: 4106 1st Qu.: 3.592 1st Qu.:35.23
Median :10.540 Median : 5930 Median :13.600 Median :43.60
Mean :10.738 Mean : 6798 Mean :28.979 Mean :46.83
3rd Qu.:12.648 3rd Qu.: 8187 3rd Qu.:52.203 3rd Qu.:59.27
Max. :15.970 Max. :25879 Max. :97.510 Max. :87.20
census type
Min. :1113 bc :44
1st Qu.:3120 prof:31
Median :5135 wc :23
Mean :5402 NA's: 4
3rd Qu.:8312
Max. :9517
> head(Prestige)
education income women prestige census type
gov.administrators 13.11 12351 11.16 68.8 1113 prof
general.managers 12.26 25879 4.02 69.1 1130 prof
accountants 12.77 9271 15.70 63.4 1171 prof
purchasing.officers 11.42 8865 9.11 56.8 1175 prof
chemists 14.62 8403 11.68 73.5 2111 prof
physicists 15.64 11030 5.13 77.6 2113 prof
> #c创建新的数据集
> Prestige_noNA <- na.omit(Prestige)
> n <- nrow(Prestige_noNA) # Number of observations = 102
> ntrain <- round(n*0.6) # 60% for training set
> set.seed(333) # Set seed for reproducible results
> tindex <- sample(n, ntrain) # Create an index
> trainPrestige <- Prestige_noNA[tindex,] # Create training set
> testPrestige <- Prestige_noNA[-tindex,] # Create test set
> #查看变量与因变量的关系
> plot(trainPrestige$prestige, trainPrestige$education) #Trend
> plot(trainPrestige$prestige, trainPrestige$income) #No trend
> plot(trainPrestige$prestige, trainPrestige$women) #No trend
> #线性回归
> lm2 <- lm(prestige~., data=trainPrestige)
Error: unexpected input in "lm2 <- lm(prestige?
> #线性回归
> lm2 <- lm(prestige ~., data=trainPrestige)
> summary(lm2)
Call:
lm(formula = prestige ~ ., data = trainPrestige)
Residuals:
Min 1Q Median 3Q Max
-13.7864 -4.0290 0.8807 4.5369 16.9482
Coefficients:
Estimate Std. Error t value Pr(>|t|)
(Intercept) -1.544e+01 9.901e+00 -1.560 0.12492
education 4.562e+00 8.320e-01 5.483 1.24e-06 ***
income 9.607e-04 3.204e-04 2.999 0.00415 **
women 7.252e-03 4.543e-02 0.160 0.87379
census 1.031e-03 7.390e-04 1.396 0.16876
typeprof 5.981e+00 5.773e+00 1.036 0.30495
typewc -1.137e+00 3.962e+00 -0.287 0.77531
---
Signif. codes: 0 ‘***’ 0.001 ‘**’ 0.01 ‘*’ 0.05 ‘.’ 0.1 ‘ ’ 1
Residual standard error: 7.145 on 52 degrees of freedom
Multiple R-squared: 0.8406, Adjusted R-squared: 0.8222
F-statistic: 45.71 on 6 and 52 DF, p-value: < 2.2e-16
> plot(lm2$fitted, lm2$residuals)
> #预测
> predict2 <- predict(lm2, newdata=testPrestige)
> #相关性
> cor(predict2, testPrestige$prestige)
[1] 0.9151361
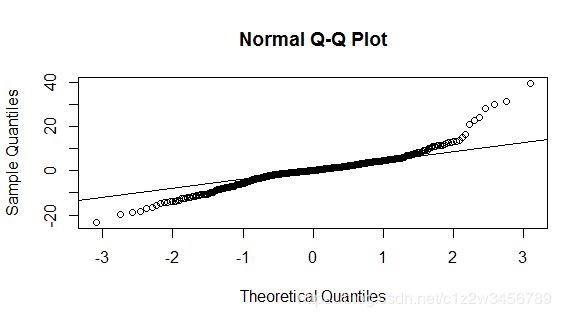
> rs <- residuals(lm1)
> qqnorm(rs)
> qqline(rs)
> library(MASS)
> data(Boston)
> names(Boston)
[1] "crim" "zn" "indus" "chas" "nox" "rm"
[7] "age" "dis" "rad" "tax" "ptratio" "black"
[13] "lstat" "medv"
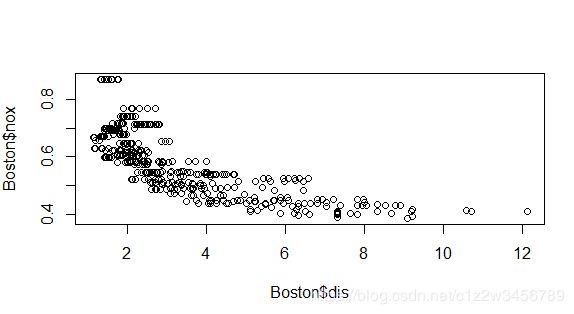
> # Scatterplot to show curvilinearity of data
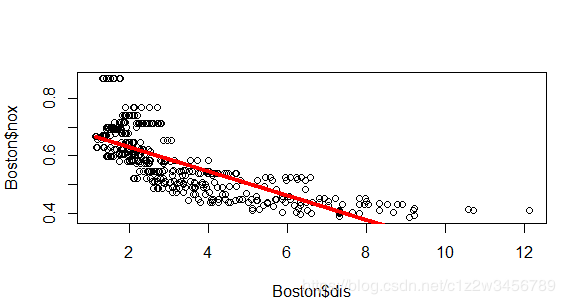
> plot(Boston$dis, Boston$nox)
> # Fit simple model first
> fit_d1 <- lm(nox ~ dis, data=Boston)
> summary(fit_d1)
Call:
lm(formula = nox ~ dis, data = Boston)
Residuals:
Min 1Q Median 3Q Max
-0.12239 -0.05212 -0.01257 0.04391 0.23041
Coefficients:
Estimate Std. Error t value Pr(>|t|)
(Intercept) 0.715343 0.006796 105.26 <2e-16 ***
dis -0.042331 0.001566 -27.03 <2e-16 ***
---
Signif. codes: 0 ‘***’ 0.001 ‘**’ 0.01 ‘*’ 0.05 ‘.’ 0.1 ‘ ’ 1
Residual standard error: 0.07412 on 504 degrees of freedom
Multiple R-squared: 0.5917, Adjusted R-squared: 0.5909
F-statistic: 730.4 on 1 and 504 DF, p-value: < 2.2e-16
> plot(Boston$dis, Boston$nox)
> lines(Boston$dis, fit_d1$fitted.values, col=2, lwd=3)
> # Fit model to predict nox (nitrogen oxides concentration)
> # using polynomial degree 2 with dis (distances to emp centers)
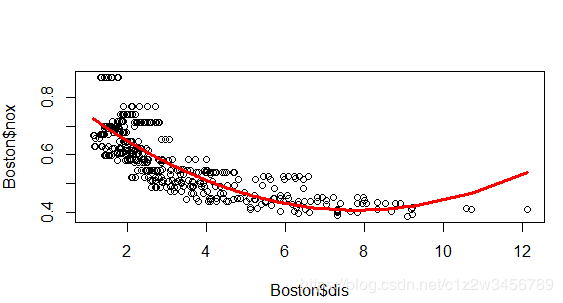
> fit_d2 <- lm(nox ~ poly(dis, 2, raw=TRUE), data=Boston)
> summary(fit_d2)
Call:
lm(formula = nox ~ poly(dis, 2, raw = TRUE), data = Boston)
Residuals:
Min 1Q Median 3Q Max
-0.129559 -0.044514 -0.007753 0.025778 0.201882
Coefficients:
Estimate Std. Error t value Pr(>|t|)
(Intercept) 0.843991 0.011196 75.39 <2e-16 ***
poly(dis, 2, raw = TRUE)1 -0.111628 0.005320 -20.98 <2e-16 ***
poly(dis, 2, raw = TRUE)2 0.007135 0.000530 13.46 <2e-16 ***
---
Signif. codes: 0 ‘***’ 0.001 ‘**’ 0.01 ‘*’ 0.05 ‘.’ 0.1 ‘ ’ 1
Residual standard error: 0.06361 on 503 degrees of freedom
Multiple R-squared: 0.6999, Adjusted R-squared: 0.6987
F-statistic: 586.4 on 2 and 503 DF, p-value: < 2.2e-16
> plot(Boston$dis, Boston$nox)
> lines(sort(Boston$dis), fit_d2$fitted.values[order(Boston$dis)], col = 2, lwd = 3)
> # Fit model to predict nox (nitrogen oxides concentration)
> # using polynomial degree 3 with dis (distances to emp centers)
> fit_d3 <- lm(nox ~ poly(dis, 3, raw=TRUE), data=Boston)
> summary(fit_d3)
Call:
lm(formula = nox ~ poly(dis, 3, raw = TRUE), data = Boston)
Residuals:
Min 1Q Median 3Q Max
-0.121130 -0.040619 -0.009738 0.023385 0.194904
Coefficients:
Estimate Std. Error t value Pr(>|t|)
(Intercept) 0.9341281 0.0207076 45.110 < 2e-16 ***
poly(dis, 3, raw = TRUE)1 -0.1820817 0.0146973 -12.389 < 2e-16 ***
poly(dis, 3, raw = TRUE)2 0.0219277 0.0029329 7.476 3.43e-13 ***
poly(dis, 3, raw = TRUE)3 -0.0008850 0.0001727 -5.124 4.27e-07 ***
---
Signif. codes: 0 ‘***’ 0.001 ‘**’ 0.01 ‘*’ 0.05 ‘.’ 0.1 ‘ ’ 1
Residual standard error: 0.06207 on 502 degrees of freedom
Multiple R-squared: 0.7148, Adjusted R-squared: 0.7131
F-statistic: 419.3 on 3 and 502 DF, p-value: < 2.2e-16
> coef(summary(fit_d3))
Estimate Std. Error t value Pr(>|t|)
(Intercept) 0.9341280720 0.0207076150 45.110365 9.853624e-179
poly(dis, 3, raw = TRUE)1 -0.1820816950 0.0146973264 -12.388763 6.078843e-31
poly(dis, 3, raw = TRUE)2 0.0219276580 0.0029329119 7.476412 3.428917e-13
poly(dis, 3, raw = TRUE)3 -0.0008849957 0.0001727172 -5.123959 4.274950e-07
> plot(Boston$dis, Boston$nox)
> lines(sort(Boston$dis), fit_d3$fitted.values[order(Boston$dis)], col = 2, lwd = 3)
