R语言 决策树、bagging、boosting、随机森林
关注微信公共号:小程在线
关注CSDN博客:程志伟的博客
R版本:3.6.1
rpart():建立分类回归树
rpart.plot():可视化分类回归树
rpart.control():设置分类回归树的参数
printcp():查看复杂度参数CP
plotcp():可视化复杂度参数CP
prune():得到决策树的修剪子树
bagging():利用袋装技术建立组合预测模型
predict.bagging():进行组合预测
boosting():利用推进技术建立组合预测模型
randomForest():建立随机森林
margin():探测边界观测
treesize():显示随机森林中各个决策树的大小
grtTree():显示随机森林中决策树的信息
importance():根据随机森林进行输入变量重要性测度
varImpPlot():随机森林对输入变量重要性的可视化
决策树
1.根节点、叶节点、中间节点
2.分类树用于分类预测,回归树用于数值型预测
3.决策树的生长:选择最佳分类变量;从分组变量中找出一个最佳分隔点
4.决策树的剪枝:预剪枝:最大深度与样本量的最小值;后减枝。
> library("rpart")
> library("rpart.plot")
Warning message:
程辑包‘rpart.plot’是用R版本3.6.2 来建造的
> ############分类回归树: rpart包
> BuyOrNot<-read.table("G:\\R语言\\大三下半年\\R语言数据挖掘方法及应用\\消费决策数据.txt",header=TRUE)
> head(BuyOrNot)
Purchase Age Gender Income
1 0 41 2 1
2 0 47 2 1
3 1 41 2 1
4 1 39 2 1
5 0 32 2 1
6 0 32 2 1
> BuyOrNot$Income<-as.factor(BuyOrNot$Income)
> BuyOrNot$Gender<-as.factor(BuyOrNot$Gender)
> Ctl<-rpart.control(minsplit=2,maxcompete=4,xval=10,maxdepth=10,cp=0)
> set.seed(12345)
> TreeFit1<-rpart(Purchase~.,data=BuyOrNot,method="class",parms=list(split="gini"),control=Ctl)
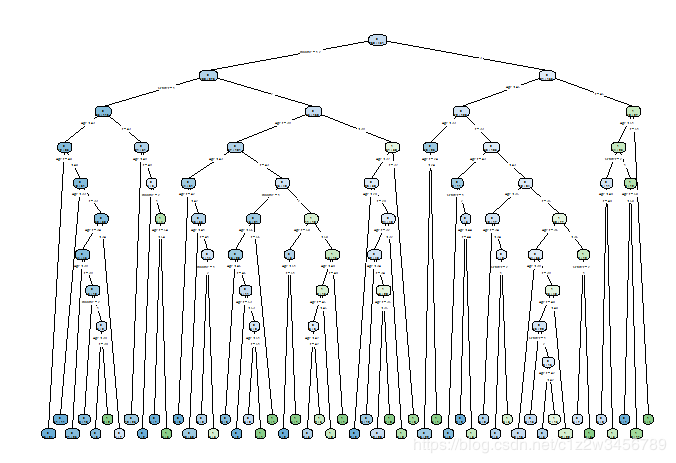
> rpart.plot(TreeFit1,type=4,branch=0,extra=2)
#三个变量Age、Gender、Income均用于决策树
#结果显示根节点有431个点,其中162个输出变量为1的观测被判为0。
#CP列表,nsplit表示样本数据经过的分组次数,rel error表示预测误差相对值的估计,xerror表示交叉验证的预测误差相对值
#第8行,CP为0,分组51次,得到52个节点,如上图所示。
Classification tree:
rpart(formula = Purchase ~ ., data = BuyOrNot, method = "class",
parms = list(split = "gini"), control = Ctl)
Variables actually used in tree construction:
[1] Age Gender Income
Root node error: 162/431 = 0.37587
n= 431
CP nsplit rel error xerror xstd
1 0.0277778 0 1.00000 1.0000 0.062070
2 0.0092593 2 0.94444 1.1605 0.063552
3 0.0061728 11 0.83333 1.1111 0.063200
4 0.0046296 22 0.75309 1.1111 0.063200
5 0.0041152 26 0.73457 1.0988 0.063098
6 0.0030864 30 0.71605 1.0988 0.063098
7 0.0020576 36 0.69753 1.1049 0.063150
8 0.0000000 51 0.66667 1.1235 0.063297
#复杂度CP值与预测误差的可视化分析
> plotcp(TreeFit1)
#依据R的默认建立决策树
> set.seed(12345)
> (TreeFit2<-rpart(Purchase~.,data=BuyOrNot,method="class",parms=list(split="gini")))
#CP参数为0.01,采用Gini系数
#节点2后面有 * 表示为叶节点,其中income取1或者2,有276个样本,其中88个输出变量误判为0,正确率68%,错误率32%。
#最终的决策树有3个叶节点,对应3条规则。
#与上面的决策树相比,性别变量不在是重要的。
n= 431
node), split, n, loss, yval, (yprob)
* denotes terminal node
1) root 431 162 0 (0.6241299 0.3758701)
2) Income=1,2 276 88 0 (0.6811594 0.3188406) *
3) Income=3 155 74 0 (0.5225806 0.4774194)
6) Age< 44.5 128 56 0 (0.5625000 0.4375000) *
7) Age>=44.5 27 9 1 (0.3333333 0.6666667) *
> rpart.plot(TreeFit2,type=4,branch=0,extra=2)
Classification tree:
rpart(formula = Purchase ~ ., data = BuyOrNot, method = "class",
parms = list(split = "gini"))
Variables actually used in tree construction:
[1] Age Income
Root node error: 162/431 = 0.37587
n= 431
CP nsplit rel error xerror xstd
1 0.027778 0 1.00000 1.0000 0.062070
2 0.010000 2 0.94444 1.1358 0.063388
#设置CP为0.008创建决策树
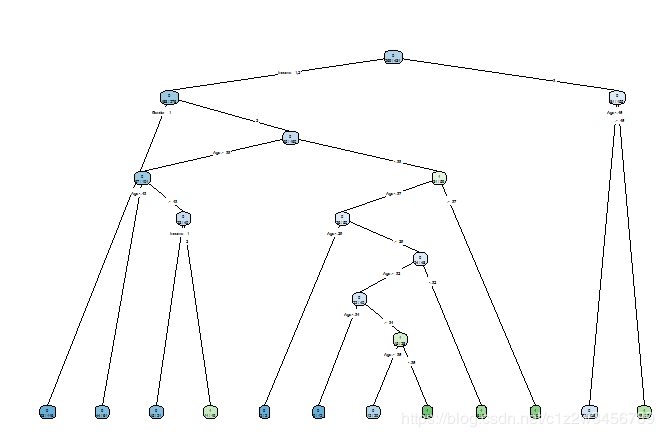
> TreeFit3<-prune(TreeFit1,cp=0.008)
> rpart.plot(TreeFit3,type=4,branch=0,extra=2)
Classification tree:
rpart(formula = Purchase ~ ., data = BuyOrNot, method = "class",
parms = list(split = "gini"), control = Ctl)
Variables actually used in tree construction:
[1] Age Gender Income
Root node error: 162/431 = 0.37587
n= 431
CP nsplit rel error xerror xstd
1 0.0277778 0 1.00000 1.0000 0.062070
2 0.0092593 2 0.94444 1.1605 0.063552
3 0.0080000 11 0.83333 1.1111 0.063200
> plotcp(TreeFit3)
#######################建立单个分类树#####################
> library("rpart")
> MailShot<-read.table("G:\\R语言\\大三下半年\\R语言数据挖掘方法及应用\\邮件营销数据.txt",header=TRUE)
> MailShot<-MailShot[,-1]
> Ctl<-rpart.control(minsplit=20,maxcompete=4,maxdepth=30,cp=0.01,xval=10)
> set.seed(12345)
> TreeFit<-rpart(MAILSHOT~.,data=MailShot,method="class",parms=list(split="gini"))
> #rpart.plot(TreeFit,type=4,branch=0,extra=1)
> CFit1<-predict(TreeFit,MailShot,type="class") #CFit1<-predict(TreeFit,MailShot)
> ConfM1<-table(MailShot$MAILSHOT,CFit1)
> (E1<-(sum(ConfM1)-sum(diag(ConfM1)))/sum(ConfM1))
[1] 0.2833333
###############利用ipred包中的bagging建立组合分类树1
> library("ipred")
Warning message:
程辑包‘ipred’是用R版本3.6.2 来建造的
> set.seed(12345)
#进行25次重采样,生成25棵分类树,预测误差为0.4567。组合误差为19.67%。
> (BagM1<-bagging(MAILSHOT~.,data=MailShot,nbagg=25,coob=TRUE,control=Ctl))
Bagging classification trees with 25 bootstrap replications
Call: bagging.data.frame(formula = MAILSHOT ~ ., data = MailShot, nbagg = 25,
coob = TRUE, control = Ctl)
Out-of-bag estimate of misclassification error: 0.4567
> CFit2<-predict(BagM1,MailShot,type="class")
> ConfM2<-table(MailShot$MAILSHOT,CFit2)
> (E2<-(sum(ConfM2)-sum(diag(ConfM2)))/sum(ConfM2))
[1] 0.1966667
#####################利用adabag包中的bagging建立组合分类树2
> library("adabag")
> MailShot<-read.table("G:\\R语言\\大三下半年\\R语言数据挖掘方法及应用\\邮件营销数据.txt",header=TRUE)
> MailShot<-MailShot[,-1]
> Ctl<-rpart.control(minsplit=20,maxcompete=4,maxdepth=30,cp=0.01,xval=10)
> set.seed(12345)
> BagM2<-bagging(MAILSHOT~.,data=MailShot,control=Ctl,mfinal = 25)
#变量的重要性
> BagM2$importance
AGE CAR GENDER INCOME MARRIED MORTGAGE REGION SAVE
17.761337 3.202805 6.126779 49.217348 7.539829 5.398284 8.425630 2.327989
> CFit3<-predict.bagging(BagM2,MailShot)
> CFit3$confusion
Observed Class
Predicted Class NO YES
NO 147 41
YES 18 94
> CFit3$error
[1] 0.1966667
###################利用adabag包中的boosting建立组合模型
#adaboost重点关注未正确预测的样本,降低预测正确的权重。
> library("adabag")
> MailShot<-read.table("G:\\R语言\\大三下半年\\R语言数据挖掘方法及应用\\邮件营销数据.txt",header=TRUE)
> MailShot<-MailShot[,-1]
> Ctl<-rpart.control(minsplit=20,maxcompete=4,maxdepth=30,cp=0.01,xval=10)
> set.seed(12345)
> BoostM<-boosting(MAILSHOT~.,data=MailShot,boos=TRUE,mfinal=25,coeflearn="Breiman",control=Ctl)
> BoostM$importance
AGE CAR GENDER INCOME MARRIED MORTGAGE REGION SAVE
23.666103 3.821141 3.597499 43.118805 5.424618 4.782976 11.057369 4.531490
> ConfM4<-table(MailShot$MAILSHOT,BoostM$class)
> (E4<-(sum(ConfM4)-sum(diag(ConfM4)))/sum(ConfM4))
[1] 0.02666667
############### 随机森林 ###################
#随机选择变量,在选择最佳分组。
> library("randomForest")
> MailShot<-read.table("G:\\R语言\\大三下半年\\R语言数据挖掘方法及应用\\邮件营销数据.txt",header=TRUE)
> MailShot<-MailShot[,-1]
> set.seed(12345)
> (rFM<-randomForest(MAILSHOT~.,data=MailShot,importance=TRUE,proximity=TRUE))
Call:
randomForest(formula = MAILSHOT ~ ., data = MailShot, importance = TRUE, proximity = TRUE)
Type of random forest: classification
Number of trees: 500
No. of variables tried at each split: 2
OOB estimate of error rate: 43.33%
Confusion matrix:
NO YES class.error
NO 107 58 0.3515152
YES 72 63 0.5333333
#各观测的各类别预测概率
> head(rFM$votes)
NO YES
1 0.5529412 0.4470588
2 0.3135135 0.6864865
3 0.7597765 0.2402235
4 0.7621622 0.2378378
5 0.3068182 0.6931818
6 0.4367816 0.5632184
#各观测作为OOB的次数
> head(rFM$oob.times)
[1] 170 185 179 185 176 174
> DrawL<-par()
> par(mfrow=c(2,1),mar=c(5,5,3,1))
> plot(rFM,main="随机森林的OOB错判率和决策树棵树")
> plot(margin(rFM),type="h",main="边界点探测",xlab="观测序列",ylab="比率差")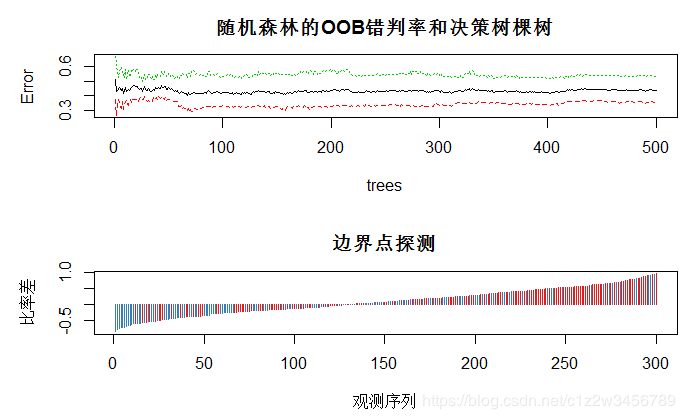
> Fit<-predict(rFM,MailShot)
> ConfM5<-table(MailShot$MAILSHOT,Fit)
> (E5<-(sum(ConfM5)-sum(diag(ConfM5)))/sum(ConfM5))
[1] 0.03
> head(treesize(rFM))
[1] 65 76 53 83 61 70
> head(getTree(rfobj=rFM,k=1,labelVar=TRUE))
left daughter right daughter split var split point status prediction
1 2 3 AGE 47.5 1
2 4 5 MARRIED 1.0 1
3 6 7 REGION 7.0 1
4 8 9 REGION 1.0 1
5 10 11 REGION 4.0 1
6 12 13 INCOME 42903.5 1
> barplot(rFM$importance[,3],main="输入变量重要性测度(预测精度变化)指标柱形图")
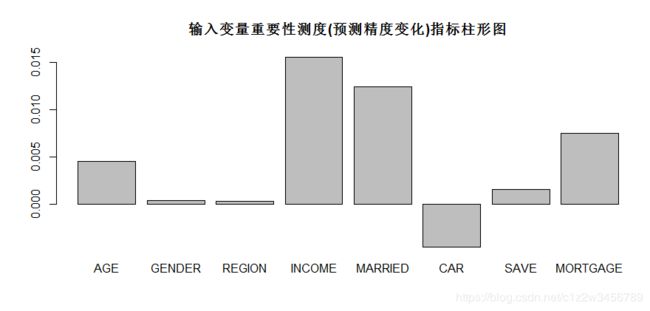
> box()
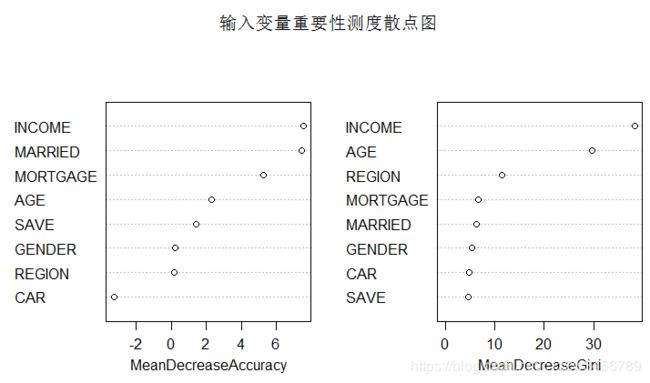
> importance(rFM,type=1)
MeanDecreaseAccuracy
AGE 2.2928880
GENDER 0.2553099
REGION 0.1752791
INCOME 7.5445185
MARRIED 7.4439171
CAR -3.2628459
SAVE 1.3998760
MORTGAGE 5.2517900
> varImpPlot(x=rFM, sort=TRUE, n.var=nrow(rFM$importance),main="输入变量重要性测度散点图")
