R语言采用多元回归建模的基本步骤
前言:本次建模过程是基于RedHat6.8或者CentOS6.8,R3.1.2,Rstudio-server
关于R3.1.2,Rstudio-server的整个配置,原始数据(已经脱敏处理,不涉及泄密,如有侵权,请随时联系)以及本分析的源码均放置在GitHub上,通过click here访问
数据导入:
#install essential packages
install.packages("rJava",dependencies=TRUE)
install.packages("xlsx",dependencies=TRUE)
install.packages("corrplot",dependencies=TRUE)
install.packages("leaps",dependencies=TRUE)
install.packages("lmtest",dependencies=TRUE)

library(rJava)
#setting workstation
setwd("/home/steven/workstation")
#source data loaded
library(xlsx)
src <- read.xlsx("/usr/local/workstation/test.xls",1,encoding="UTF-8")
数据处理:
#drop columns that is useless
src <- src[,-c(1)]
src <- src[,c(1:6,8:10,7)]
#1、description statistic
attach(src)
names(src)
mean=sapply(src,mean)
max=sapply(src,max)
min=sapply(src,min)
median=sapply(src,median)
sd=sapply(src,sd)
cbind(mean,max,min,median,sd)
建立回归模型步骤:
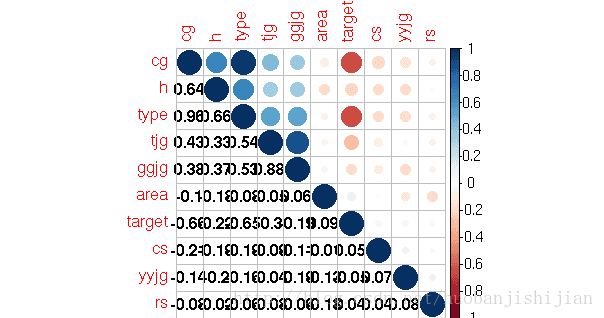
#1、参数全部默认情况下的相关系数图
#混合方法之上三角为圆形,下三角为黑色数字
library(corrplot)

corr <- cor(src[,1:10])
corrplot(corr = corr,order="AOE",type="upper",tl.pos="tp")
corrplot(corr = corr,add=TRUE, type="lower",
         method="number",order="AOE", col="black",
         diag=FALSE,tl.pos="n", cl.pos="n")
输出结果如下:
 1.                mean         max        min      median           sd
rs      1211.924227  14000.0000    10.0000   980.00000 1.595892e+03
cs         1.168495      6.0000     0.0000     1.00000 1.471799e+00
area       7.045862     11.0000     1.0000     7.00000 3.168251e+00
type       1.588235      2.0000     1.0000     2.00000 4.923985e-01
cg         2.251246      3.0000     1.0000     3.00000 9.289564e-01
h          1.395813      2.0000     1.0000     1.00000 4.892685e-01
tjg     7843.554775   8454.1182  6909.4630  8092.36154 3.942006e+02
ggjg   14147.557328  16600.0000 11700.0000 14600.00000 1.015608e+03
yyjg      94.608809    106.6788    86.6484    95.00923 3.467941e+00
target 29893.998495 145085.0000     4.9000 27700.00000 1.939754e+04
#1、参数全部默认情况下的相关系数图
#混合方法之上三角为圆形,下三角为黑色数字
library(corrplot)
corr <- cor(src[,1:10])
corrplot(corr = corr,order="AOE",type="upper",tl.pos="tp")
corrplot(corr = corr,add=TRUE, type="lower",
method="number",order="AOE", col="black",
diag=FALSE,tl.pos="n", cl.pos="n")#2.画相关图选择回归方程的形式
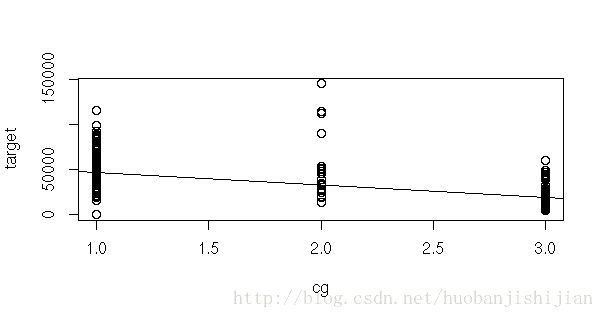
plot(target~cg);abline(lm(target~cg))
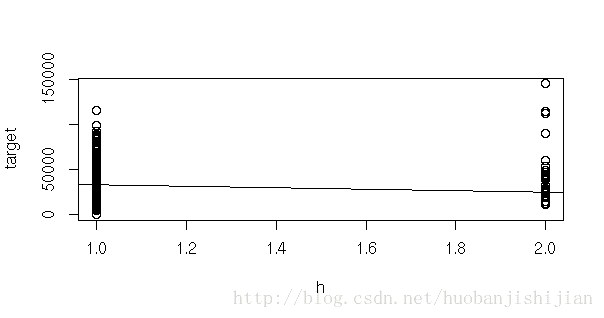
plot(target~h);abline(lm(target~h))
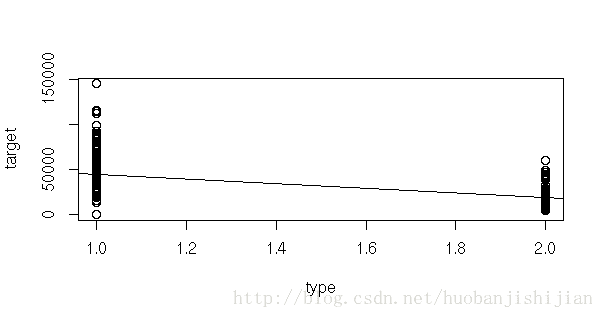
plot(target~type);abline(lm(target~type))
plot(target~tjg);abline(lm(target~tjg))
plot(target~ggjg);abline(lm(target~ggjg))
plot(target~area);abline(lm(target~area))
plot(target~cs);abline(lm(target~cs))
plot(target~yyjg);abline(lm(target~yyjg))
plot(target~rs);abline(lm(target~rs))#3.do regression and check results
dim(src)[1]
lm.test<-lm(target~rs+cs+area+type+cg+h+tjg+ggjg+yyjg,data=src)
summary(lm.test)结果如下:
Residuals:
   Min     1Q Median     3Q    Max
-45689  -8172   -999   5979  90290

Coefficients:
              Estimate Std. Error t value Pr(>|t|)
(Intercept)  9.678e+04  1.487e+04   6.507 1.22e-10 ***
rs           9.556e-02  2.643e-01   0.362  0.71777
cs          -5.617e+02  2.887e+02  -1.946  0.05195 .
area         2.137e+02  1.390e+02   1.537  0.12463
type        -3.414e+04  4.309e+03  -7.923 6.20e-15 ***
cg          -1.846e+03  2.136e+03  -0.864  0.38776
h            1.336e+04  1.158e+03  11.535  < 2e-16 ***
tjg         -1.198e+01  2.460e+00  -4.868 1.31e-06 ***
ggjg         7.148e+00  1.079e+00   6.625 5.66e-11 ***
yyjg        -3.731e+02  1.280e+02  -2.916  0.00363 **
---
Signif. codes:  0 ‘***’ 0.001 ‘**’ 0.01 ‘*’ 0.05 ‘.’ 0.1 ‘ ’ 1

Residual standard error: 12980 on 993 degrees of freedom
Multiple R-squared:  0.5564,    Adjusted R-squared:  0.5523
F-statistic: 138.4 on 9 and 993 DF,  p-value: < 2.2e-16
#4.delete variable which is not significant(rs,area)
lm.test<-lm(target~cs+type+cg+h+tjg+ggjg+yyjg,data=src)
summary(lm.test)
Residuals:
Min 1Q Median 3Q Max
-46131 -8655 -1038 5716 91466
Coefficients:
Estimate Std. Error t value Pr(>|t|)
(Intercept) 101636.162 14537.438 6.991 4.99e-12 ***
cs -572.037 288.600 -1.982 0.04774 *
type -34143.617 4296.236 -7.947 5.14e-15 ***
cg -1815.420 2127.549 -0.853 0.39370
h 12995.825 1132.191 11.478 < 2e-16 ***
tjg -12.728 2.411 -5.279 1.59e-07 ***
ggjg 7.474 1.058 7.068 2.96e-12 ***
yyjg -389.096 127.090 -3.062 0.00226 **
---
Signif. codes: 0 ‘***’ 0.001 ‘**’ 0.01 ‘*’ 0.05 ‘.’ 0.1 ‘ ’ 1
Residual standard error: 12980 on 995 degrees of freedom
Multiple R-squared: 0.5553, Adjusted R-squared: 0.5522
F-statistic: 177.5 on 7 and 995 DF, p-value: < 2.2e-16#4.1.use residual analysis delete outlier points
plot(lm.test,which=1:4)
src = src[-c(12,765,788,790),]
dim(src)[1]得到的四个图依次为:
4.1普通残差与拟合值的残差图
4.2正态QQ的残差图(若残差是来自正态总体分布的样本,则QQ图中的点应该在一条直线上)
4.3标准化残差开方与拟合值的残差图(对于近似服从正态分布的标准化残差,应该有95%的样本点落在[-2,2]的区间内。这也是判断异常点的直观方法)
4.4cook统计量的残差图(cook统计量值越大的点越可能是异常值,但具体阀值是多少较难判别)
从图中可见,12,765,788,790三个样本存在异常,需要剔除。
Residuals:
   Min     1Q Median     3Q    Max
-46131  -8655  -1038   5716  91466

Coefficients:
              Estimate Std. Error t value Pr(>|t|)
(Intercept) 101636.162  14537.438   6.991 4.99e-12 ***
cs            -572.037    288.600  -1.982  0.04774 *
type        -34143.617   4296.236  -7.947 5.14e-15 ***
cg           -1815.420   2127.549  -0.853  0.39370
h            12995.825   1132.191  11.478  < 2e-16 ***
tjg            -12.728      2.411  -5.279 1.59e-07 ***
ggjg             7.474      1.058   7.068 2.96e-12 ***
yyjg          -389.096    127.090  -3.062  0.00226 **
---
Signif. codes:  0 ‘***’ 0.001 ‘**’ 0.01 ‘*’ 0.05 ‘.’ 0.1 ‘ ’ 1

Residual standard error: 12980 on 995 degrees of freedom
Multiple R-squared:  0.5553,    Adjusted R-squared:  0.5522
F-statistic: 177.5 on 7 and 995 DF, p-value: < 2.2e-16#5.异方差检验
#5.1GQtest,H0(误差平方与自变量,自变量的平方和其交叉相都不相关),
#p值很小时拒绝H0,认为上诉公式有相关性,存在异方差
src.test<-residuals(lm.test)
library(lmtest)
gqtest(lm.test)
#5.2BPtest,H0(同方差),p值很小时认为存在异方差
bptest(lm.test)结果如下:
Goldfeld-Quandt test

data:  lm.test
GQ = 1.841, df1 = 494, df2 = 493, p-value = 8.865e-12
---------
studentized Breusch-Pagan test

data:  lm.test
BP = 93.9696, df = 7, p-value < 2.2e-16
两个检验的p值都很小时认为存在异方差,需要修正异方差
#6.修正异方差
#修正的方法选择FGLS即可行广义最小二乘
#6.1修正步骤
#6.1.1将y对xi求回归,算出res--u
#6.1.2计算log(u^2)
#6.1.3做log(u^2)对xi的辅助回归 log(u^2),得到拟合函数g=b0+b1x1+..+b2x2
#6.1.4计算拟合权数1/h=1/exp(g),并以此做wls估计

lm.test2<-lm(log(resid(lm.test)^2)~cs+type+cg+h+tjg+ggjg+yyjg,data=src)
lm.test3<-lm(target~cs+type+cg+h+tjg+ggjg+yyjg,weights=1/exp(fitted(lm.test2)),data=src)
summary(lm.test3)
结果如下:
Weighted Residuals:
    Min      1Q  Median      3Q     Max
-5.0707 -1.3281 -0.2952  1.0471  9.3937

Coefficients:
              Estimate Std. Error t value Pr(>|t|)
(Intercept)  61648.563  13382.003   4.607 4.62e-06 ***
cs            -320.525    153.174  -2.093   0.0366 *
type        -26556.135   4766.749  -5.571 3.26e-08 ***
cg           -4653.887   2430.178  -1.915   0.0558 .
h            11107.677    692.499  16.040  < 2e-16 ***
tjg            -14.767      2.224  -6.638 5.20e-11 ***
ggjg             7.919      1.049   7.548 9.96e-14 ***
yyjg            97.193    133.864   0.726   0.4680
---
Signif. codes:  0 ‘***’ 0.001 ‘**’ 0.01 ‘*’ 0.05 ‘.’ 0.1 ‘ ’ 1

Residual standard error: 1.868 on 995 degrees of freedom
Multiple R-squared:  0.7178,    Adjusted R-squared:  0.7159
F-statistic: 361.6 on 7 and 995 DF, p-value: < 2.2e-16#7.1计算解释变量相关稀疏矩阵的条件数k,k<100多重共线性程度很小,100<k<1000较强,>1000严重
src[1:9]
XX<-cor(src[1:9])
kappa(XX)结果如下:
[1] 160.9175K>100 and K<1000,说明共线性较强,接下来找出共线性强的变量
$values
[1] 3.4192494 1.3030312 1.1563047 0.9199288 0.9041041 0.7562702 0.4205589 0.1011783
[9] 0.0193744

$vectors
             [,1]         [,2]       [,3]        [,4]        [,5]         [,6]
 [1,] -0.05733512 -0.501899822  0.2026552 -0.50588080  0.52056535 -0.417997886
 [2,] -0.14763837  0.007109461  0.4116265 -0.46530338 -0.75069812 -0.163284493
 [3,] -0.05138859  0.665302345 -0.1293286 -0.01422961  0.11408507 -0.699971313
 [4,]  0.49655847 -0.112090220 -0.1278988  0.02167963 -0.16337262 -0.239671005
 [5,]  0.46448785 -0.167719865 -0.2352263  0.06705893 -0.20715145 -0.265202906
 [6,]  0.40186335 -0.218262940 -0.2471633 -0.09210826 -0.11794142  0.001433268
 [7,]  0.40615453  0.174700538  0.5215318  0.06040287  0.12878909  0.132238544
 [8,]  0.40635458  0.274603051  0.4469450 -0.07777933  0.20683789  0.127659436
 [9,] -0.13555751 -0.333404886  0.4101634  0.71008868 -0.09781406 -0.383530067
             [,7]         [,8]         [,9]
 [1,] -0.02888533  0.034061964 -0.010937600
 [2,]  0.03865752 -0.008224625 -0.020908812
 [3,]  0.16651561  0.084133996  0.004735702
 [4,] -0.30629410 -0.209415519  0.708684433
 [5,] -0.36523446  0.094446587 -0.663876582
 [6,]  0.83587224  0.093172922  0.004206256
 [7,] -0.04882043  0.695383719  0.094120334
 [8,]  0.10362759 -0.660605287 -0.217813589
 [9,]  0.17586069 -0.101388052 -0.011659019
#8.修正多重共线性---逐步回归法
#ps2:step中可进行参数设置:
#direction=c("both","forward","backward")来选择逐步回归
#的方向,默认both,forward时逐渐增加解释变两个数,backward则相反。
step(lm.test)结果如下:
Start:  AIC=19007.25
target ~ cs + type + cg + h + tjg + ggjg + yyjg

       Df  Sum of Sq        RSS   AIC
- cg    1 1.2269e+08 1.6778e+11 19006
               1.6766e+11 19007
- cs    1 6.6200e+08 1.6832e+11 19009
- yyjg  1 1.5794e+09 1.6924e+11 19015
- tjg   1 4.6960e+09 1.7235e+11 19033
- ggjg  1 8.4171e+09 1.7608e+11 19054
- type  1 1.0643e+10 1.7830e+11 19067
- h     1 2.2201e+10 1.8986e+11 19130

Step:  AIC=19005.98
target ~ cs + type + h + tjg + ggjg + yyjg

       Df  Sum of Sq        RSS   AIC
               1.6778e+11 19006
- cs    1 5.9084e+08 1.6837e+11 19008
- yyjg  1 1.5277e+09 1.6931e+11 19013
- tjg   1 5.3779e+09 1.7316e+11 19036
- ggjg  1 1.2972e+10 1.8075e+11 19079
- h     1 2.2083e+10 1.8986e+11 19128
- type  1 1.5438e+11 3.2216e+11 19658

Call:
lm(formula = target ~ cs + type + h + tjg + ggjg + yyjg, data = src)

Coefficients:
(Intercept)           cs         type            h          tjg         ggjg
  99781.026     -533.902   -37652.525    12909.485      -13.222        7.941
       yyjg
   -381.819
所以最终入选的变量是:formula = target ~ cs + type + h + tjg + ggjg + yyjg


