机器学习3 多类别分类(Multi-class Classification)和神经网络(Neural Networks)
多类别分类
我们在上一篇博客中利用logistic回归做了二分类,这里我们继续利用logistic回归做多类别分类。
这里我们利用一种非常常见的情形作为例子,就是手写数字识别。
数据集
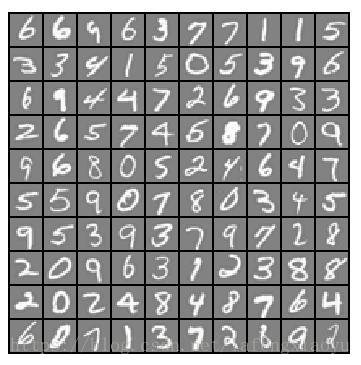
我们在这里用到的是课程提供的数据集,共有5000个数据,从0到9每个数字有500个数据组成,每个数据都是一张20*20像素的图,因此每张图具有400个像素点。数据集用一个矩阵表示,是5000*400的规模,下图是随机挑选了100张图进行显示

首先分为10类本质上就是做了十个分为两类:是1和不是1,是2和不是2等等。分别基于特征计算其概率,换句话说,就是计算 θTx θ T x 值的大小(这里可以看出其实二分类就是一个特例,二分类中认定的标准是大于0或者小于0,但是多分类中可以同时有好几个都是大于0的,就需要计算大小进行判别了),取对应几率最大的一个数,可以认为这个数就是最有可能出现的数,从而进行判断。至于特征,我们可以认为图片具有400个特征,就是每个像素点都是判断的一个特征,因此 θ θ 是有401个数组成的向量。
向量化Logistic回归
利用多个一对多(one-vs-all)logistic回归,为了使得训练更加有效,需要对其进行向量化,以避免进行循环(loop)操作。
向量化代价函数
在logistic回归中,代价函数是
J(θ)=1m∑i=1m[−y(i)log(hθ(x(i)))−(1−y(i))log(1−hθ(x(i)))] J ( θ ) = 1 m ∑ i = 1 m [ − y ( i ) log ( h θ ( x ( i ) ) ) − ( 1 − y ( i ) ) log ( 1 − h θ ( x ( i ) ) ) ]
为了在加法中计算高效,我们可以利用矩阵乘法。令 X X 和 θ θ 分别为: X=⎡⎣⎢⎢⎢⎢⎢−(x(1))T−−(x(2))T−⋮−(x(m))T−⎤⎦⎥⎥⎥⎥⎥,θ=⎡⎣⎢⎢⎢⎢θ0θ1⋮θn⎤⎦⎥⎥⎥⎥ X = [ − ( x ( 1 ) ) T − − ( x ( 2 ) ) T − ⋮ − ( x ( m ) ) T − ] , θ = [ θ 0 θ 1 ⋮ θ n ]
矩阵相乘,有
Xθ=⎡⎣⎢⎢⎢⎢⎢−(x(1))Tθ−−(x(2))Tθ−⋮−(x(m))Tθ−⎤⎦⎥⎥⎥⎥⎥=⎡⎣⎢⎢⎢⎢⎢−θT(x(1))−−θT(x(2))−⋮−θT(x(m))−⎤⎦⎥⎥⎥⎥⎥ X θ = [ − ( x ( 1 ) ) T θ − − ( x ( 2 ) ) T θ − ⋮ − ( x ( m ) ) T θ − ] = [ − θ T ( x ( 1 ) ) − − θ T ( x ( 2 ) ) − ⋮ − θ T ( x ( m ) ) − ]
向量化梯度函数
在logistic回归中的梯度是下面的式子定义的
∂J(θ)∂θj=1m∑i=1m(hθ(x(i))−y(i))x(i)j ∂ J ( θ ) ∂ θ j = 1 m ∑ i = 1 m ( h θ ( x ( i ) ) − y ( i ) ) x j ( i )
我们将其重写为矩阵形式
⎡⎣⎢⎢⎢⎢⎢⎢⎢⎢⎢⎢⎢∂J(θ)∂θ0∂J(θ)∂θ1∂J(θ)∂θ2⋮∂J(θ)∂θn⎤⎦⎥⎥⎥⎥⎥⎥⎥⎥⎥⎥⎥=1m⎡⎣⎢⎢⎢⎢⎢⎢⎢⎢⎢∑mi=1(hθ(x(i))−y(i))x(i)0∑mi=1(hθ(x(i))−y(i))x(i)1∑mi=1(hθ(x(i))−y(i))x(i)2⋮∑mi=1(hθ(x(i))−y(i))x(i)n⎤⎦⎥⎥⎥⎥⎥⎥⎥⎥⎥=1m∑i=1m((hθ(x(i))−y(i))x(i))=1mXT(hθ(x)−y) [ ∂ J ( θ ) ∂ θ 0 ∂ J ( θ ) ∂ θ 1 ∂ J ( θ ) ∂ θ 2 ⋮ ∂ J ( θ ) ∂ θ n ] = 1 m [ ∑ i = 1 m ( h θ ( x ( i ) ) − y ( i ) ) x 0 ( i ) ∑ i = 1 m ( h θ ( x ( i ) ) − y ( i ) ) x 1 ( i ) ∑ i = 1 m ( h θ ( x ( i ) ) − y ( i ) ) x 2 ( i ) ⋮ ∑ i = 1 m ( h θ ( x ( i ) ) − y ( i ) ) x n ( i ) ] = 1 m ∑ i = 1 m ( ( h θ ( x ( i ) ) − y ( i ) ) x ( i ) ) = 1 m X T ( h θ ( x ) − y )
其中
hθ(x)−y=⎡⎣⎢⎢⎢⎢⎢hθ(x(1))−y(1)hθ(x(2))−y(2)⋮hθ(x(m))−y(m)⎤⎦⎥⎥⎥⎥⎥ h θ ( x ) − y = [ h θ ( x ( 1 ) ) − y ( 1 ) h θ ( x ( 2 ) ) − y ( 2 ) ⋮ h θ ( x ( m ) ) − y ( m ) ]
以上的表示方法可以让我们在避免用循环的时候求得了偏导数。大大提高了程序的运行速度。
向量化正则化的logistic回归
在上面的函数中加入正则化项
J(θ)=1m∑i=1m[−y(i)log(hθ(x(i)))−(1−y(i))log(1−hθ(x(i)))]+λ2m∑j=1nθ2j J ( θ ) = 1 m ∑ i = 1 m [ − y ( i ) log ( h θ ( x ( i ) ) ) − ( 1 − y ( i ) ) log ( 1 − h θ ( x ( i ) ) ) ] + λ 2 m ∑ j = 1 n θ j 2
其中 θ0 θ 0 (偏移项)是不需要进行正则化的
对应的,上式的偏导数定义为
∂J(θ)∂θ0=1m∑i=1m(hθ(x(i))−y(i))x(i)j for j=0 ∂ J ( θ ) ∂ θ 0 = 1 m ∑ i = 1 m ( h θ ( x ( i ) ) − y ( i ) ) x j ( i ) f o r j = 0
∂J(θ)∂θj=(1m∑i=1m(hθ(x(i))−y(i))x(i)j)+λmθj for j≥1 ∂ J ( θ ) ∂ θ j = ( 1 m ∑ i = 1 m ( h θ ( x ( i ) ) − y ( i ) ) x j ( i ) ) + λ m θ j f o r j ≥ 1
根据上式,计算代价与梯度函数的MATLAB代码为
function [J, grad] = lrCostFunction(theta, X, y, lambda)
%LRCOSTFUNCTION Compute cost and gradient for logistic regression with
%regularization
%   J = LRCOSTFUNCTION(theta, X, y, lambda) computes the cost of using
%   theta as the parameter for regularized logistic regression and the
%   gradient of the cost w.r.t. to the parameters.

% Initialize some useful values
m = length(y); % number of training examples

% You need to return the following variables correctly
J = 0;
grad = zeros(size(theta));

% ====================== YOUR CODE HERE ======================
% Instructions: Compute the cost of a particular choice of theta.
%               You should set J to the cost.
%               Compute the partial derivatives and set grad to the partial
%               derivatives of the cost w.r.t. each parameter in theta
%
% Hint: The computation of the cost function and gradients can be
%       efficiently vectorized. For example, consider the computation
%
%           sigmoid(X * theta)
%
%       Each row of the resulting matrix will contain the value of the
%       prediction for that example. You can make use of this to vectorize
%       the cost function and gradient computations.
%
% Hint: When computing the gradient of the regularized cost function,
%       there're many possible vectorized solutions, but one solution
%       looks like:
%           grad = (unregularized gradient for logistic regression)
%           temp = theta;
%           temp(1) = 0;   % because we don't add anything for j = 0
%           grad = grad + YOUR_CODE_HERE (using the temp variable)
%
my = y.*(-1);
oy = 1.-y;
h = X*theta;
first = (1/m)*(my.*log(sigmoid(h)));
sec = (1/m)*oy.*log(1-sigmoid(h));
lterm = (lambda/(2*m)) * (theta.^2);
t= first-sec;
J1 = sum(t);
J2 = sum(lterm)-lterm(1);
J = J1+J2;
grad = (1/m)*(X'*(sigmoid(h)-y));
temp = grad(1);
grad = (1/m)*(X'*(sigmoid(h)-y))+(lambda/m)*theta;
grad(1) = temp;

% =============================================================

end
一对多(One-vs-all)分类
在具有N个特征,需要分为K类的问题中,需要求解的参数在矩阵空间 Θ∈RK×(n+1) Θ ∈ R K × ( n + 1 ) 中,其中 Θ Θ 的每一行对应一个logistic回归中的参数。因此这个过程可以用for循环对K类分别操作。在本例中K=10,N=400,所以 Θ Θ 是一个10*401的矩阵
MATLAB求解每一行的 θ θ 值,如下
function [all_theta] = oneVsAll(X, y, num_labels, lambda)
%ONEVSALL trains multiple logistic regression classifiers and returns all
%the classifiers in a matrix all_theta, where the i-th row of all_theta
%corresponds to the classifier for label i
%   [all_theta] = ONEVSALL(X, y, num_labels, lambda) trains num_labels
%   logisitc regression classifiers and returns each of these classifiers
%   in a matrix all_theta, where the i-th row of all_theta corresponds
%   to the classifier for label i

% Some useful variables
m = size(X, 1);
n = size(X, 2);

% You need to return the following variables correctly
all_theta = zeros(num_labels, n + 1);

% Add ones to the X data matrix
X = [ones(m, 1) X];

% ====================== YOUR CODE HERE ======================
% Instructions: You should complete the following code to train num_labels
%               logistic regression classifiers with regularization
%               parameter lambda.
%
% Hint: theta(:) will return a column vector.
%
% Hint: You can use y == c to obtain a vector of 1's and 0's that tell use
%       whether the ground truth is true/false for this class.
%
% Note: For this assignment, we recommend using fmincg to optimize the cost
%       function. It is okay to use a for-loop (for c = 1:num_labels) to
%       loop over the different classes.
%
%       fmincg works similarly to fminunc, but is more efficient when we
%       are dealing with large number of parameters.
%
% Example Code for fmincg:
%
%     % Set Initial theta
%     initial_theta = zeros(n + 1, 1);
%
%     % Set options for fminunc
%     options = optimset('GradObj', 'on', 'MaxIter', 50);
%
%     % Run fmincg to obtain the optimal theta
%     % This function will return theta and the cost
%     [theta] = ...
%         fmincg (@(t)(lrCostFunction(t, X, (y == c), lambda)), ...
%                 initial_theta, options);
%

initial_theta = zeros(n + 1, 1);

options = optimset('GradObj', 'on', 'MaxIter', 50);
for c = 1:num_labels
    [theta] = ...
             fmincg(@(t)(lrCostFunction(t, X, (y == c), lambda)), ...
                     initial_theta, options);
    all_theta(c,:)=theta(:);
end

% =========================================================================

end
fmincg函数和fminunc的作用是一样的,这里进行过优化。
分类预测
将之前的数据按照计算出的 Θ Θ 进行计算,取其值最大的,认为是某类的概率最大的
function p = predictOneVsAll(all_theta, X)
%PREDICT Predict the label for a trained one-vs-all classifier. The labels
%are in the range 1..K, where K = size(all_theta, 1).
%  p = PREDICTONEVSALL(all_theta, X) will return a vector of predictions
%  for each example in the matrix X. Note that X contains the examples in
%  rows. all_theta is a matrix where the i-th row is a trained logistic
%  regression theta vector for the i-th class. You should set p to a vector
%  of values from 1..K (e.g., p = [1; 3; 1; 2] predicts classes 1, 3, 1, 2
%  for 4 examples)

m = size(X, 1);
num_labels = size(all_theta, 1);

% You need to return the following variables correctly
p = zeros(size(X, 1), 1);

% Add ones to the X data matrix
X = [ones(m, 1) X];

% ====================== YOUR CODE HERE ======================
% Instructions: Complete the following code to make predictions using
%               your learned logistic regression parameters (one-vs-all).
%               You should set p to a vector of predictions (from 1 to
%               num_labels).
%
% Hint: This code can be done all vectorized using the max function.
%       In particular, the max function can also return the index of the
%       max element, for more information see 'help max'. If your examples
%       are in rows, then, you can use max(A, [], 2) to obtain the max
%       for each row.
%
h = all_theta * X';
[temp,p] = max(h);
p = p';

% =========================================================================

end
得到预测的准确率是94.98%
我们可以找几个预测错的数字看一下,比如将第1564个数据的3识别成了2,我们看一下
这难道不是2。。。说明有的时候识别的还是不错的嘿嘿~~
神经网络
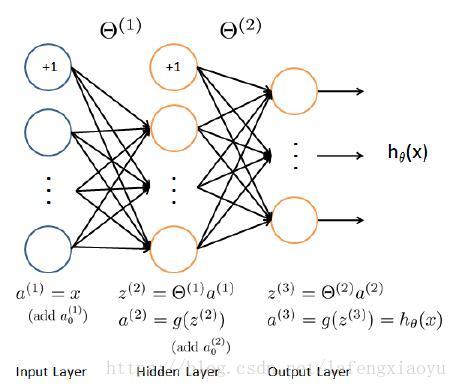
在实现了多类别分类之后,我们先引入神经网络的概念,神经网络事实上就是在上面模型的基础上增加了隐藏层。下面就是我们对于手写数字识别建立了神经网络模型

输入的就是5000*400的数据,输出的是5000*10的矩阵。对于每个数据,有一个1*10的向量,相当于分别对应0~9的概率。
这里设置中间层有25个元素,再加上常数偏移量,因此对于每一个数据来讲,输入的是1*401,乘以矩阵 Θ(1) Θ ( 1 ) (规模是25*401)得到的是 z(2) z ( 2 ) (1*26),通过sigmoid函数得到 a(2) a ( 2 ) 进行第二次矩阵乘法,乘以矩阵 Θ(2) Θ ( 2 ) (规模是10*26)得到的是 z(3) z ( 3 ) (1*10),通过sigmoid函数得到 a(3) a ( 3 ) ,就是一个对于每个数字对应的概率,取其中的最大值认为是那个数。
到现在预测一下:为什么神经网络好使,因为把直接的输入和输出中间加了一层(隐藏层),可能层数多一些有利于决策成功。把一次矩阵乘法换成了两次矩阵乘法。
这一章的两个 Θ Θ 是现成的已经学习好的,因此我们只需要前向传播(Feedforward Propagation),得到了预测结果,预测的准确率达到了97.5%。预测函数如下
function p = predict(Theta1, Theta2, X)
%PREDICT Predict the label of an input given a trained neural network
%   p = PREDICT(Theta1, Theta2, X) outputs the predicted label of X given the
%   trained weights of a neural network (Theta1, Theta2)

% Useful values
m = size(X, 1);
num_labels = size(Theta2, 1);

% You need to return the following variables correctly
p = zeros(size(X, 1), 1);
X = [ones(m, 1) X];
% ====================== YOUR CODE HERE ======================
% Instructions: Complete the following code to make predictions using
%               your learned neural network. You should set p to a
%               vector containing labels between 1 to num_labels.
%
% Hint: The max function might come in useful. In particular, the max
%       function can also return the index of the max element, for more
%       information see 'help max'. If your examples are in rows, then, you
%       can use max(A, [], 2) to obtain the max for each row.
%
%Z2 = Theta1*X';
%Z2 = [ones(1,m);Z2];
%Z3 = Theta2*sigmoid(Z2);


%h = sigmoid(Z3);
%[temp,p] = max(h);
%p = p';
z1 = X * Theta1';
a1 = sigmoid(z1);

a1 = [ones(m, 1) a1];
z2 = a1 * Theta2';
a2 = sigmoid(z2);

[val, p] = max(a2, [], 2);

% =========================================================================

end
比如第143号预测错误
将0识别成了1。。。你别说还真像